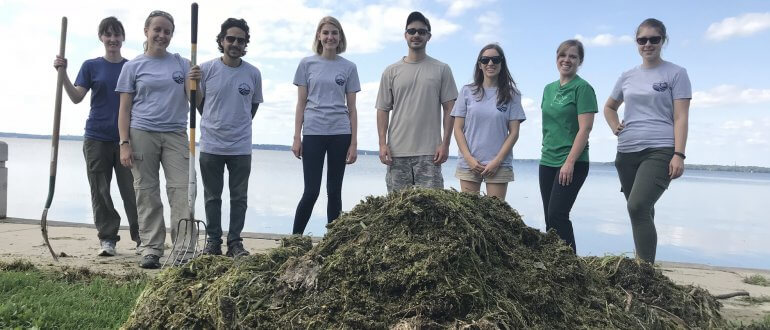
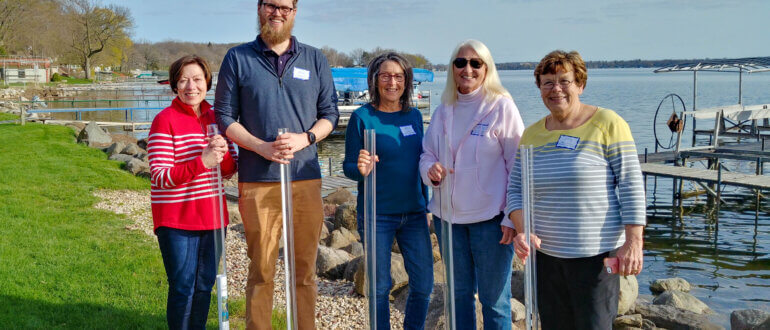
It was a year of obstacles for our lakes, but volunteers are dedicated to improving our waters
From cyanobacteria (blue-green algae) blooms, to elevated bacteria (E. coli) levels, to flooding, our lakes have had a tough season. With our lakes facing so many obstacles, it makes Clean Lakes Alliance even more appreciative of its volunteers.
Unveiled and launched at a May 18, 2022, public release party hosted by Clean Lakes Alliance, “Renew the Blue” is a cross-sector partnership initiative that commits to untapping the full potential of Greater Madison’s lakes. The initiative, developed and led by a diverse coalition of 19 community groups, offers an updated blueprint for cleaner lakes and beaches. If you love the lakes and care about their future, Renew the Blue calls upon you, our fellow stakeholders, to lead by example and play a role in the solutions.
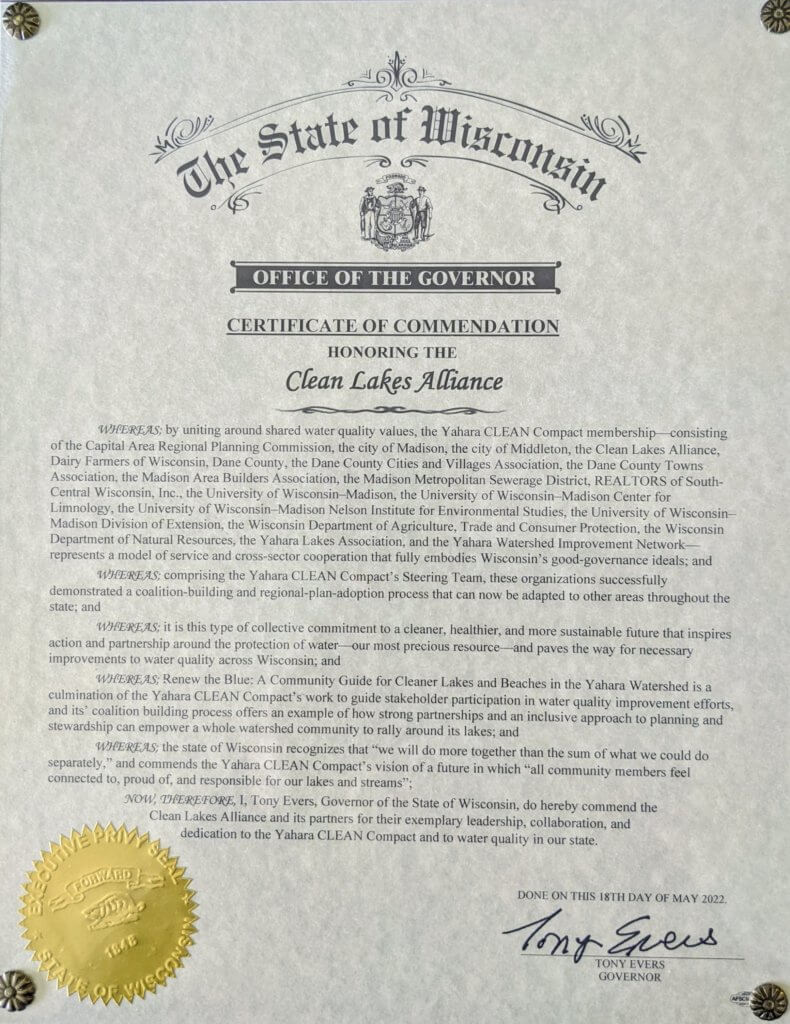
Renew the Blue and Yahara CLEAN Compact Certificate of Commendation from State of Wisconsin’s Office of the Governor
What is the Yahara CLEAN Compact?
The Yahara Watershed and its five lakes define Dane County and Greater Madison’s sense of place. Lakes Mendota, Monona, Wingra, Waubesa, and Kegonsa contribute significantly to the region’s economic vitality, recreational offerings, and local quality of life. Clean and healthy lakes are truly a benchmark of a healthy community.
Investments over the years have laid the foundation for future water quality improvements. However, our lakes remain federally impaired for failing to meet basic water quality and use standards. Land use and climate impacts, such as heavy rain and runoff, and other headwinds threaten our progress.
The Yahara CLEAN Compact is a coalition of partners and collaborators who are working to improve the condition and usability of our lakes and beaches. It does this by expanding and strengthening the community partnership to clean up our lakes, and by uniting around a common vision and action plan to which we can be accountable. Ultimately, it is a promise to build on our past successes and cooperatively deliver the needed solutions and actionable timelines that will improve water quality.
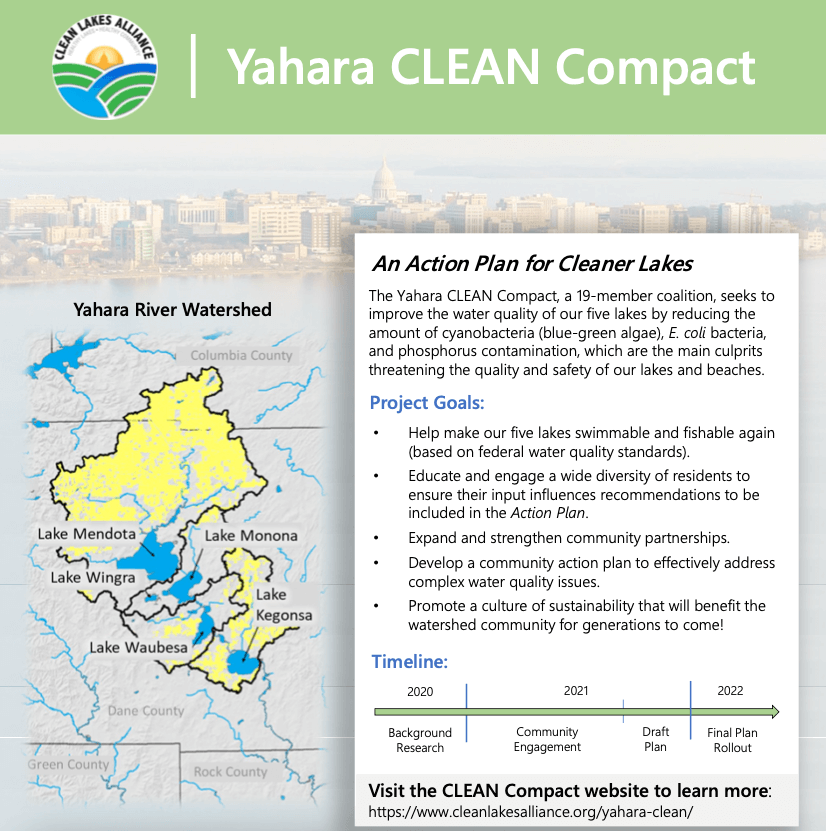
Yahara CLEAN Compact information
Click the image on the left to download information about the Yahara CLEAN Compact. (Note that the Greater Madison Lakes Survey was administered in 2021 to help inform the planning work and is no longer active.)
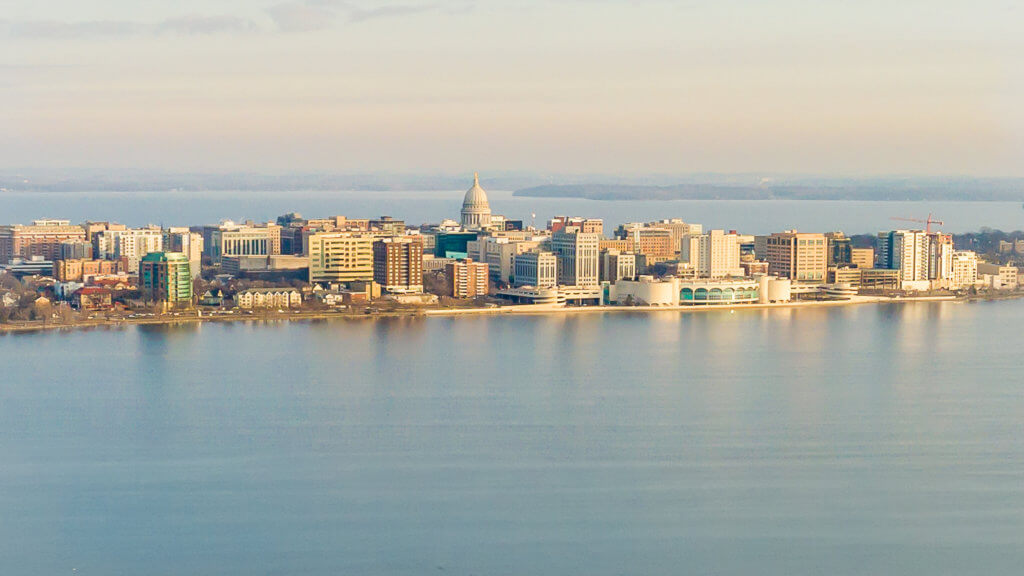
The City of Madison is located on an isthmus between lakes Mendota and Monona in the Yahara Watershed. Other lakes in the watershed include Wingra, Waubesa, and Kegonsa. Photo courtesy Robert Bertera.
Background
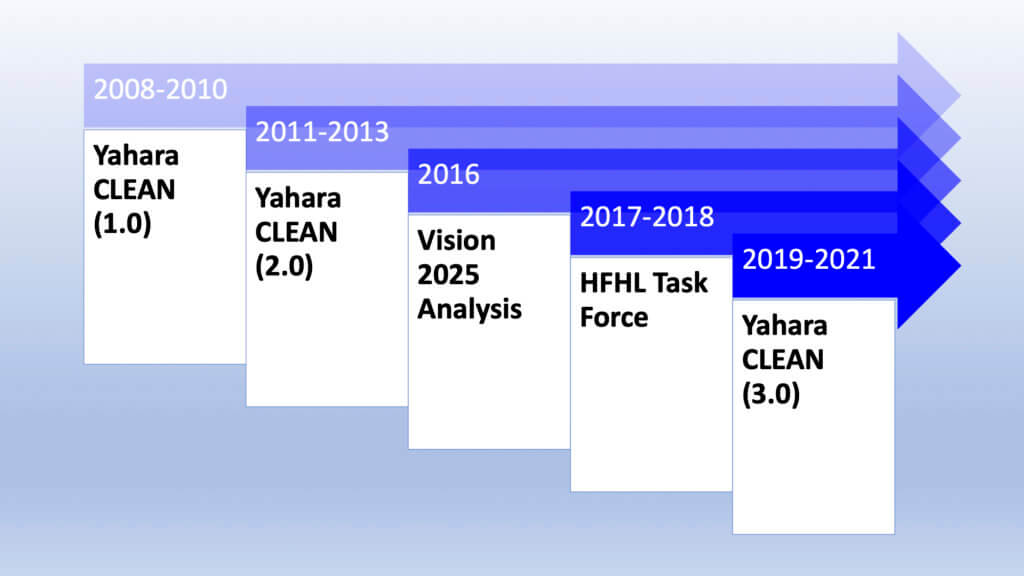
Clean lakes won’t happen overnight. Progress requires a clear plan and dedicated coalition of organizations and resources. In 2008, Dane County, City of Madison, Wisconsin Department of Natural Resources, and Wisconsin Department of Agriculture, Trade and Consumer Protection launched a lake cleanup partnership called Yahara CLEAN (Capital Lakes Environmental Assessment and Needs). Two years later, the group released a report outlining 70 recommendations. The recommendations sought to reduce phosphorus and E. coli contamination that can negatively impact water quality and close our beaches (Yahara CLEAN 1.0).
Yahara CLEAN timeline
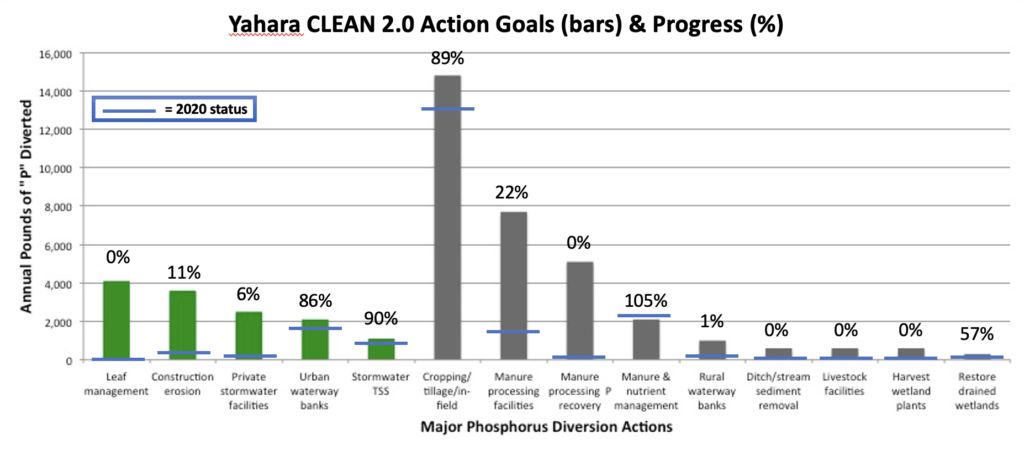
In 2011, Clean Lakes Alliance reconvened the Yahara CLEAN partners to turn the list of 70 recommendations into a streamlined action plan with clear goals, costs, and metrics. The partners hired an engineering firm to identify the 14 most cost-effective, ready-to-implement projects and practices to help reach a 50% phosphorus reduction goal (Yahara CLEAN 2.0). If successful, UW Center for Limnology scientists estimated a doubling of the number of summer days when our lakes are clear and free of algae blooms.
Yahara CLEAN 2.0 action goals and progress made – updated May 2022
In 2016, Clean Lakes Alliance evaluated the pace of community progress in carrying out the recommended action priorities set forth in the 2012 plan. The analysis showed that we would not reach our goals anytime soon, suggesting more would need to be done at a faster pace (Vision 2025 Analysis). This understanding was reaffirmed in 2018 when the Dane County Board of Supervisors approved a Healthy Farms Healthy Lakes (HFHL) Task Force recommendation to update our community lake-cleanup plan.
Looking to the future
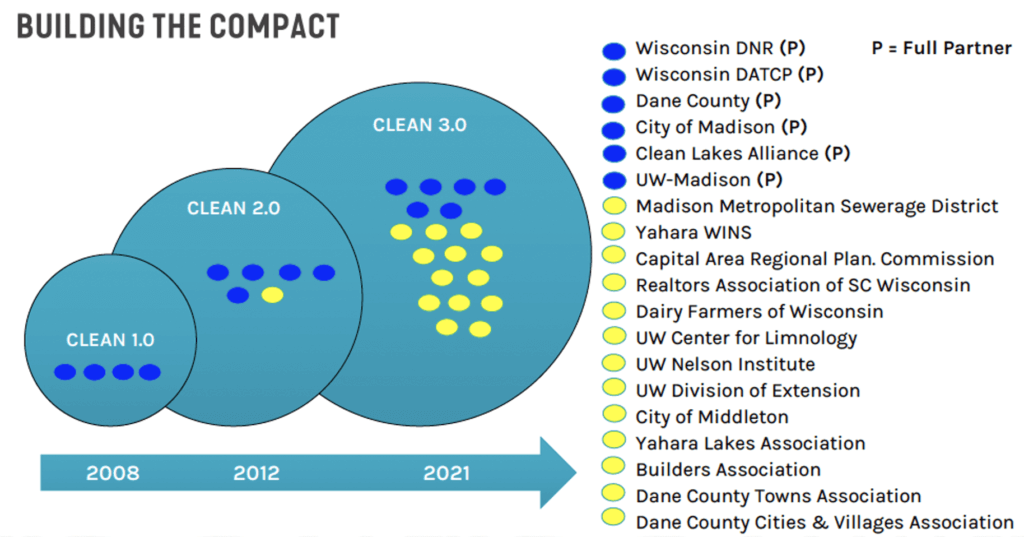
In 2019, after six years of promoting action and tracking our community’s progress, Clean Lakes Alliance reconvened and expanded the Yahara CLEAN partnership to update the cleanup plan. Called the Yahara CLEAN Compact (see Letter of Intent page 1 and page 2), coalition members sought to account for accomplishments and progress to date, re-evaluate phosphorus reduction targets, and set forth revised strategies, costs and timelines to complete the needed work (Yahara CLEAN 3.0). The Compact’s overarching goal is to make our lakes swimmable again. At the same time, it aims to promote a culture of watershed sustainability that will benefit this and future generations.
Evolution of the Yahara CLEAN Compact – Yahara CLEAN 3.0 includes more partners and collaborators than past versions
Yahara CLEAN Strategic Action Plan for Phosphorus Reduction
Yahara CLEAN Compact Participants
Partners*
City of Madison
Clean Lakes Alliance
Dane County
University of Wisconsin-Madison
Wisconsin Department of Agriculture, Trade and Consumer Protection
Wisconsin Department of Natural Resources
Collaborators**
Capital Area Regional Planning Commission
City of Middleton
Dairy Farmers of Wisconsin
Dane County Cities & Villages Association
Dane County Towns Association
Madison Area Builders Association
Madison Metropolitan Sewerage District
REALTORS Association of South Central Wisconsin
UW-Madison Center for Limnology
UW-Madison Division of Extension
UW-Madison Nelson Institute for Environmental Studies
Partners are voting members of the Executive Committee under the Compact, providing agreed upon staff and financial resources to facilitate the Yahara CLEAN updating process. A two-year, annual contribution of $25,000 ($50,000 total) is requested from each partner to help pay for related costs. Represented by an appointed lead designee and co-designee, partners are expected to:
1) participate on the Executive Committee to make decisions related to budget, consultant hires, final recommendations, and project deliverables; commit to send a representative to at least 5 of every 7 Executive Committee meetings;
2) participate on the Steering Team to finalize the scope of work and oversee its implementation;
3) participate on Subgroups as needed to gather detailed or technical information and to provide analysis and deliberation;
4) assist in the development of as-needed Requests for Proposals, and vote on the selection of any needed consultants with contracts executed by Clean Lakes Alliance;
5) furnish agreed upon information, staff support, and financial resources helpful to the effort;
6) provide input and direction to any contracted consultants;
7) agree to a public communication strategy and process;
8) sign off on any final recommendations and project deliverables produced under this Compact; and
9) support and work to implement the updated plan upon its completion.
Collaborators are supporting agencies or organizations that often play a significant cooperating role in reducing watershed phosphorus and/or achieving water quality improvements. A two-year, annual contribution of $1,000 ($2,000 total) is requested to demonstrate full investment in the effort and to help pay for related costs. Collaborators are provided opportunities for input and information sharing, but are not voting members of the Executive Committee under the Compact. Represented by an appointed lead designee and co-designee, collaborators are expected to:
1) participate on the Steering Team to provide guidance and information to the Executive Committee on goals, scope of work, consultant hires, final recommendations, project deliverables, and public outreach; commit to send a representative to at least 3 of every 4 Steering Team meetings;
2) participate on Subgroups as needed to gather detailed or technical information and to provide analysis and deliberation;
3) share information, perspectives, guidance, and advice within the Steering Team and Subgroups, and as needed with contracted consultants; and
4) support and work to implement the updated plan upon its completion.
All collaborators serve on the Steering Team. The Steering Team is an advisory body, which uses a gradient-of-agreement tool to get a sense of the group, and to share its members’ expertise, perspectives, and guidance with the Executive Team.
Challenges and opportunity
We are fortunate that our community is coming together like never before in a shared effort to improve the lakes. Through the work of the Yahara CLEAN Compact, renewed momentum and new opportunities are being leveraged, effectively building on past success and giving us all a role to play.
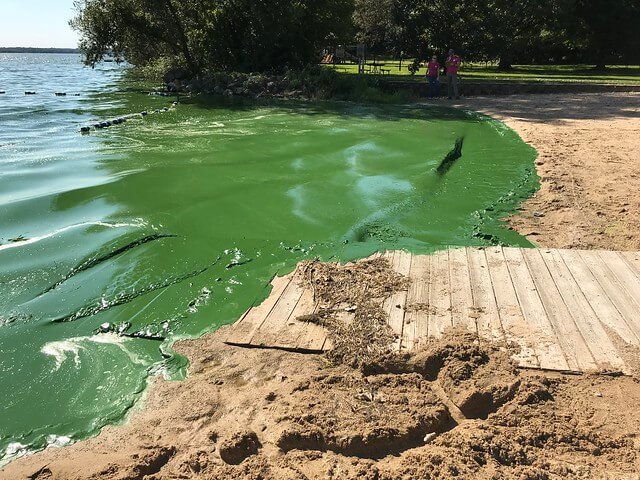
Phosphorus is a naturally occurring element found in materials such as leaves, soil, and animal waste. When it enters our lakes from urban and rural runoff, it is known to promote the growth of algae and cyanobacteria blooms. Scientists have found that one pound of phosphorus can generate up to 500 pounds of algae. (Above: Cyanobacteria bloom on Lake Kegonsa in September 2018)
Project Phases, Activities and Outcomes
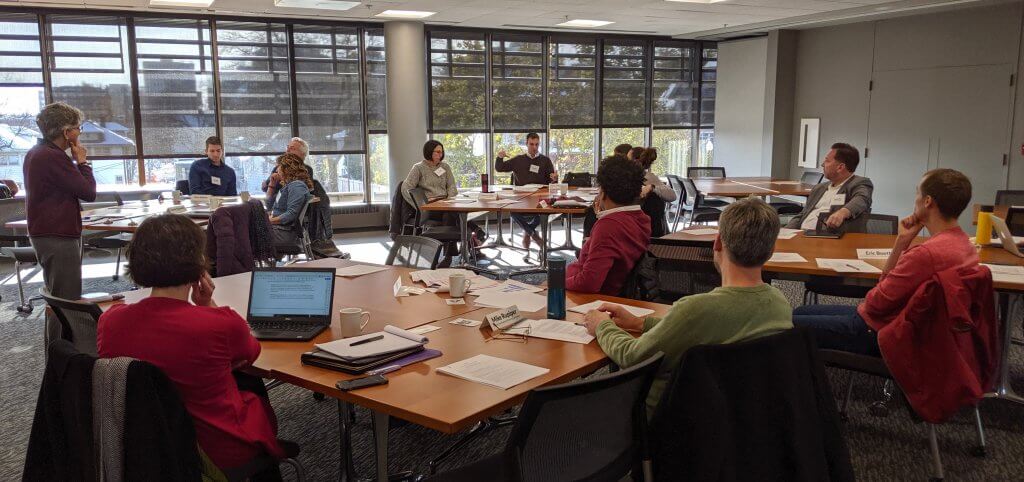
The project steering team consisting of appointed partner and collaborator designees met monthly for more than two years starting in August of 2019. The team’s work included a re-evaluation of the state of the science, a multi-faceted public engagement process, and the eventual development of a stakeholder action guide, titled Renew the Blue: A Community Guide for Clean Lakes & Beaches in the Yahara Watershed.
Phases of the Compact followed the Yahara CLEAN Compact Logic Model.
The main goal of the Yahara CLEAN Engineering Report was to develop a list of action items that can be reasonably implemented to result in an approximately 50% reduction in the total annual phosphorus load delivered to the Yahara lakes.
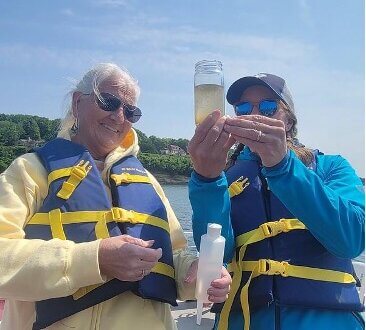
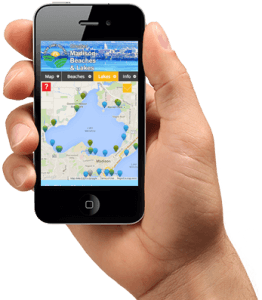
Clean Lakes Alliance’s LakeForecast water quality monitoring program completed its 11th season in 2023. This program is entirely volunteer implemented, with 90 trained monitors assessing water quality conditions from nearshore and offshore locations across all five Yahara lakes (Mendota, Monona, Wingra, Waubesa, and Kegonsa). From Memorial Day through Labor Day, volunteers recorded water clarity, air and water temperature, waterfowl presence, extent of floating plant debris, and the severity of green algae and cyanobacteria at public beaches, lakeside parks, and private piers. Submitted data can be seen in real-time on lakeforecast.org or our free app allowing the general public to stay up to date on current lake conditions.
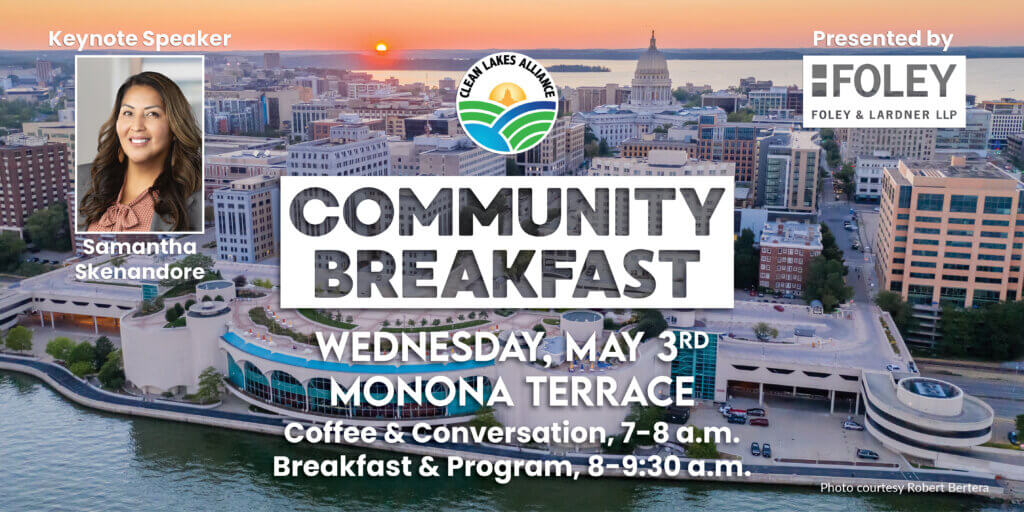
Date: Wednesday, May 3rd, 2023 Time: 7 – 8 a.m. coffee and conversation, 8 – 9:30 a.m. breakfast and program Location: Monona Terrace Community and Convention Center (1 John Nolen Dr., Madison)
Please join us for our Clean Lakes Community Breakfast on Wednesday, May 3rd, 2023! We will continue the tradition of bringing together our watershed’s premier scientists, business and organizational leaders, heads of government, and officials from the Ho-Chunk Nation to learn more about the lakes (originally known as Teejop) and new opportunities for continued collaboration and progress.
Clean Lakes Alliance and its fellow Yahara CLEAN Compact members will highlight the latest science and Renew the Blue stakeholder guidance that will direct future cleanup actions.
About our keynote speaker
Samantha Skenandore is a Federal Indian and Tribal Law-experienced attorney for Quarles, and an enrolled member of the Ho-Chunk Nation. She previously served as an elected Associate Justice for the Ho-Chunk Nation Supreme Court. As a rights-of-nature proponent, she supports advocating for laws that protect land and water.
Thank you sponsors!
Presented by: Foley and Lardner LLP Major sponsors: Alliant Energy, CG Schmidt, Lands’ End, Hovde Properties, Johnson Financial Group, Madison Gas and Electric, UW Health, WKOW 27 News
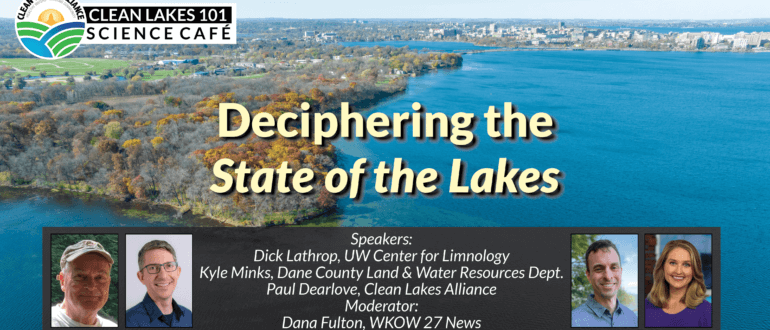
Join us for this in-person edition of Clean Lakes 101 from 4:30 – 5:30 p.m. on Tuesday, May 21st. We’ll hear three panelists discuss the conditions, trends, and water quality drivers affecting the five Yahara lakes.
Register by entering your information in the box below
About this Talk
The State of the Lakes provides an annual synopsis of how Greater Madison’s five Yahara lakes (Mendota, Monona, Wingra, Waubesa, and Kegonsa) are doing. Focusing on major drivers and indicators of water quality, the analysis summarizes lake and watershed health factors, trends, and the likely causes of observed conditions. The latest report features lake-by-lake health dashboards and covers five areas of watershed impact and lake response.
Authored by Clean Lakes Alliance Deputy Director and Chief Science Officer Paul Dearlove, the annual State of the Lakes is a product of collaboration involving multiple government and scientific contributors. They include: U.S. Geological Survey, University of Wisconsin-Madison Center for Limnology, Wisconsin Department of Natural Resources, Wisconsin Salt Wise, Public Health Madison & Dane County, Dane County Land & Water Resources, and Clean Lakes Alliance’s volunteer LakeForecast monitors.
About our Speakers/Panelists
Richard “Dick” Lathrop has been studying the Yahara chain of lakes since 1975, first on a 2-year federally funded project, then for the next 33 years as a research limnologist for the Wisconsin DNR. Besides his Yahara lakes research that led to a mid-career PhD from UW-Madison, Dick has championed other lake restoration projects including at Devil’s Lake and Lake Wingra. After retiring, Dick continues working on local lake issues through his 26-year Honorary Fellowship at the UW Center for Limnology including on their North-Temperate Lakes Long-Term Ecological Research project.
Kyle Minks is the Watershed Manager with the Dane County Land and Water Resources Department and has worked for the County since 2011. His responsibilities include coordinating the County’s efforts in implementing Watershed initiatives and projects, providing support for the two Community Manure Digesters within the County, and quantifying and reporting on County Ecosystem Services. He graduated from the University of Wisconsin Stevens Point with Bachelor’s Degrees in both Biology and Water Resources Management in 2007. He also attended the University of Wisconsin Madison graduating with Masters Degrees in both Water Resources Management and Soil Science in 2010.
Paul Dearlove joined Clean Lakes Alliance in 2014 and is the organization’s deputy director and chief science officer. His primary focus is on building watershed stewardship and promoting phosphorus-reduction actions to improve water quality. This work includes creating opportunities for people to become more informed and involved as donors, volunteers, and program participants. He most recently served as the managing director of the Yahara CLEAN Compact, a 19-partner coalition that developed “Renew the Blue: A Community Guide for Cleaner Lakes & Beaches in the Yahara Watershed.” Prior to Clean Lakes Alliance, Paul prepared comprehensive lake rehabilitation plans as a consultant and spent 15 years as Lake Manager of the Lake Ripley Management District (Jefferson County, WI). He earned his M.S. in Water Resources Management from the University of Wisconsin-Madison’s Nelson Institute for Environmental Studies, and has served on the boards of the American Water Resources Association (Wisconsin Section), Wisconsin Lakes, and the Friends of Lake Wingra.
Event Moderator
Dana Fulton joined the 27 Storm Track Weather Team in September 2023 and forecasts the weather for 27 News Wake Up Wisconsin weekday mornings from 4:30-7am. She holds a degree in Meteorology from Mississippi State University and a degree in Journalism from Western Illinois University. Prior to joining WKOW, Dana worked at WISC News 3, WACH in South Carolina, KVAL in Oregon, and WEEK in Peoria, IL. At WACH, she was the Chief Meteorologist and led the team through the historic landfall of Hurricane Matthew. A Midwest girl at heart, Dana loves forecasting all four seasons, especially winter weather. She enjoys how invested Wisconsinites are in the weather since the forecast impacts all of us.
Event Details
This event will be held in person only at The Edgewater hotel – grand ballroom level 5 (1001 Wisconsin Pl, Madison, WI 53703). Doors open at 4:00 p.m. The program runs from 4:30 – 5:30 p.m. A Q/A session will follow the presentation as time allows. Complimentary event parking will be available at The Edgewater parking ramp. Parking spots fill up quickly and may be limited depending on hotel capacity.
Join us for this Clean Lakes 101 on Wednesday, November 8th to hear about progress being made to improve water quality in the Yahara Watershed. Register as an in-person attendee or to receive a Zoom link through your confirmation email and watch virtually.
Register by entering your information in the box below
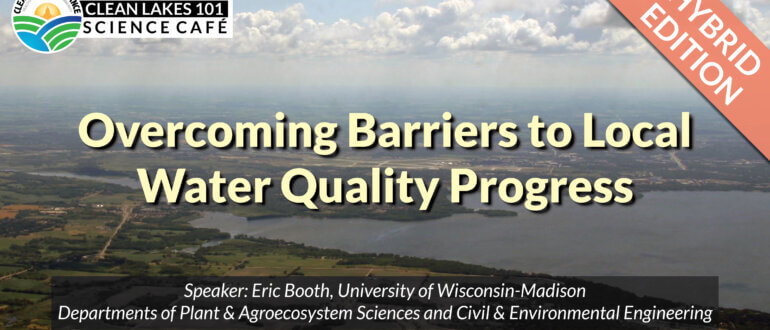
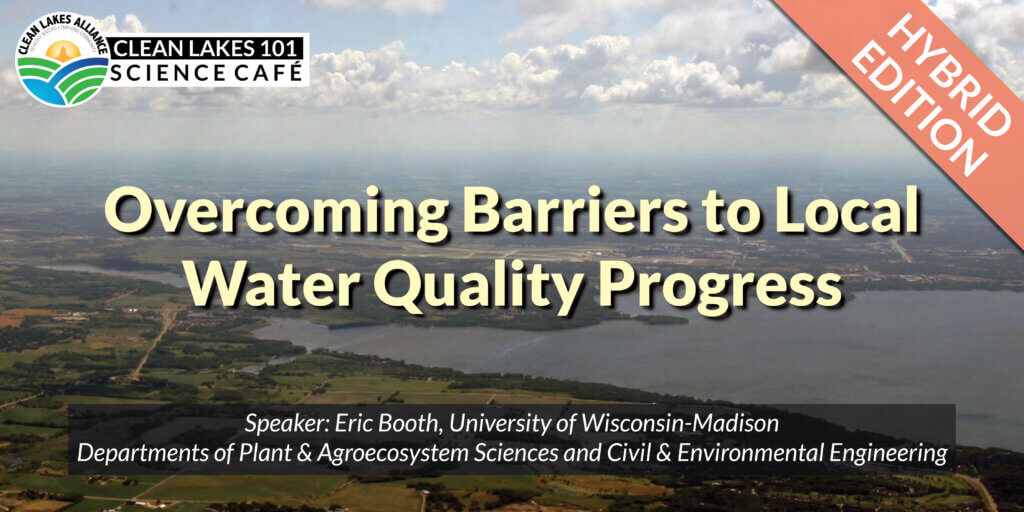
About this Talk
What is needed to make substantial progress on improving water quality in the Yahara Watershed? Many amazing people and partnerships are working hard on this immense challenge. Eric will focus this talk on two aspects that are starting to enter more into the water quality conversation and how they can be implemented: 1) balancing the watershed phosphorus budget and 2) increasing perennial agroecosystems. Reducing the supply of phosphorus that is available for transport from land to water is critical for long-term success. Recent progress in dairy nutrition and manure export are helping but we still have room for improvement. As a complementary approach, increasing the number of acres devoted to perennial agroecosystems – such as well-managed, rotational grazing of dairy heifers – can prevent existing phosphorus in watershed soils from being transported downstream while providing many other benefits.
About our Speaker
Eric Booth
Eric Booth is an associate research scientist at UW-Madison in the Departments of Plant & Agroecosystem Sciences and Civil & Environmental Engineering. He holds a BS in environmental engineering from UW-Madison (2004), MS in hydrologic science from UC-Davis (2006), and PhD in limnology from UW-Madison (2011). His disciplinary background has water as a centerpiece and includes topics such as hydroecology, impacts of climate and land-use change, urban stormwater management, wetland/stream restoration, water quality, groundwater hydrology, fluvial geomorphology, environmental history, agroecology, remote sensing, and numerical modeling. In addition, Eric also served as an official delegate to Clean Lakes Alliance’s Yahara CLEAN Compact that produced RENEW THE BLUE: A Community Guide for Cleaner Lakes & Beaches in the Yahara Watershed and has contributed to many State of the Lakes reports for the organization.
Event Details
This event will be held at The Edgewater hotel – grand ballroom level 5 (1001 Wisconsin Pl, Madison, WI 53703). Doors open at 7:30 a.m. The program runs from 8 – 9 a.m. A Q/A session will follow the presentation as time allows. Complimentary event parking will be available at The Edgewater parking ramp. Parking spots fill up quickly and may be limited depending on hotel capacity.
A Zoom link will be sent to all registrants via the confirmation email.
Join us for this in-person or virtual hybrid edition of Clean Lakes 101 to hear about Dane County’s many projects to keep our lakes clean and mitigate the impacts of climate change. Register as an in-person attendee or to receive a Zoom link through your confirmation email and watch virtually.
Register by entering your information in the box below
About this Talk
Hear from Dane County Executive Joe Parisi and Laura Hicklin, Director of Dane County’s Land & Water Resources Department as they describe the County’s many projects to keep our lakes clean and mitigate the impacts of climate change. From more extreme weather with increased rain in the spring, to dryer, hotter summers and winters, the risks of climate change become clearer all time. These changes are exacerbating existing threats to the Yahara lakes, such as increased phosphorus runoff.
During this presentation, you’ll learn the latest information about specific projects that advance Renew the Blue such as Suck the Muck, manure treatment, and conservation cover programs, along with updates on aquatic plant management, lake levels, Yahara River sediment removal, and the ongoing efforts to combat climate change.
About our Speakers
Dane County Executive: Joe Parisi has called Dane County home his entire life. He sought out public service as a way to give back to a community that has given so much to him. Joe was first elected as County Executive, the chief elected leader of Dane County, in 2011 after 6 years in the State Assembly and 8 years as Dane County Clerk. Joe’s priority is to ensure that everyone in our community has access to the opportunity to succeed. He believes investing in people pays big dividends. Joe knows this can work because he experienced it. Now Joe believes it is his turn to give back to ensure that our children’s generation has access to the same opportunities that were available to him. Joe and his wife, Erin Thornley Parisi, raised their two daughters on Madison’s east side. With a population of more than 500,000 and an annual county budget of $600 million, Dane is Wisconsin’s second largest county. Dane County has the highest private sector job and population growth in Wisconsin.
Laura Hicklin: Laura Hicklin is the Director of the Dane County Land & Water Resources Department. The Land & Water Resources Department protects and enhances the natural, cultural, and historic resources of Dane County; provides the County’s residents with a broad array of accessible, high quality resource-based recreational services and facilities; and supports residents, communities, local governments, and other agencies and organizations in their resource management and protection activities. Laura’s goal is to bring civility to challenging discussions about natural resource management in Dane County.
Event Details
This event will be held at The Edgewater hotel – grand ballroom level 5 (1001 Wisconsin Pl, Madison, WI 53703). Doors open at 7:30 a.m. The program runs from 8 – 9 a.m. A Q/A session will follow the presentation as time allows. Complimentary event parking will be available at The Edgewater parking ramp. Parking spots fill up quickly and may be limited depending on hotel capacity.
A Zoom link will be sent to all registrants in a confirmation email.
In 2022, our volunteers embarked on the 10th season of LakeForecast water quality monitoring. This work involved collecting nearshore condition reports at piers, beaches, parks, and access points around the five Yahara lakes. From May through September, volunteers measured water clarity, recorded air and water temperature, identified the presence of green algae and cyanobacteria, and noted additional visual observations. Reports are entered into the LakeForecast app where all data are updated in real time.
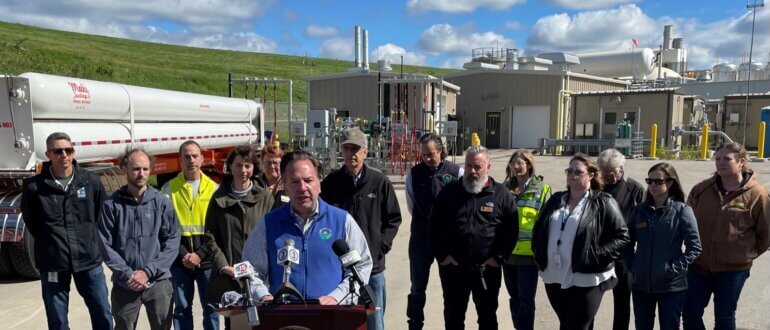
Dane County Executive Joe Parisi recently introduced a 2023 budget proposal that could be a game changer for our lakes. The budget proposal includes an initial $3 million investment for a proposed study for a third Dane County manure digester. If approved, the proposal will lay the groundwork for the design and siting of a regional cow manure processing facility. The proposed budget follows the release of RENEW THE BLUE: A Community Guide for Cleaner Lakes & Beaches in the Yahara Watershed.
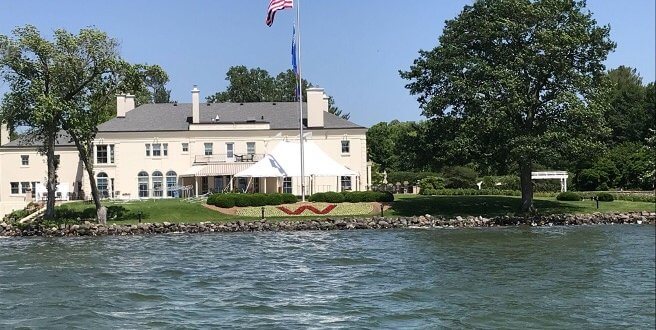
Clean Lakes Alliance is proud to partner with the Wisconsin Executive Residence Foundation, along with other local organizations, to fund and implement a lakeshore restoration along 294 feet of Lake Mendota shoreline. Located at the iconic Executive Residence, the project will replace 7,184 square feet of existing turf with 32 species of native plants, wildflowers, grasses, and shrubs. In all, a total of 3,177 native plants will be added to the shoreline area!
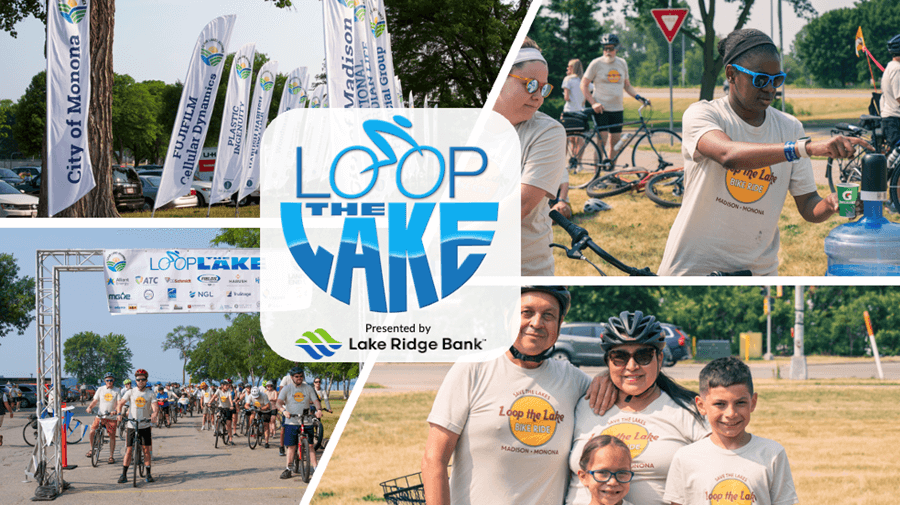
Support clean, healthy lakes with Clean Lakes Alliance’s 12th Annual Loop the Lake Bike Ride, presented by Lake Ridge Bank. Loop the Lake is an at-your-own-pace bike ride around Lake Monona on Saturday, June 15th that raises funds to protect and preserve Greater Madison’s lakes. Make a day of it while you enjoy entertaining and educational activities at many parks along the route.
Fun and educational stops (see information below) Super soft t-shirt, compliments of Lands’ End Food cart item Free beer or seltzer, courtesy of Bell’s Brewery (21+)