
2025 State of the Lakes
2025 State of the Lakes
Written by Paul Dearlove, Clean Lakes Alliance Deputy Director and Chief Science Officer
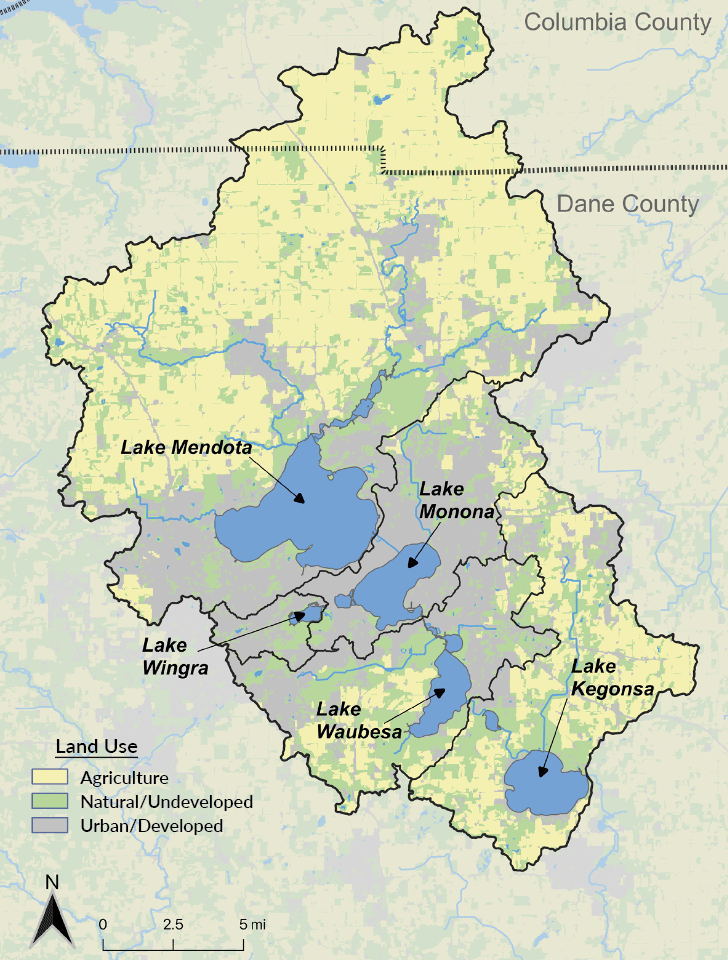
The State of the Lakes is an annual health checkup of Dane County’s five Yahara lakes — Mendota, Monona, Wingra, Waubesa, and Kegonsa. The chain of lakes and the land areas that drain to them are shown in Figure 1.
Focusing on major drivers and indicators of water quality, the report summarizes various lake and watershed health metrics, trends, and the likely causes of observed conditions. This report begins by presenting a water quality health dashboard for each lake before reviewing five broader categories of watershed impact and lake response. It then concludes with on‑land improvement actions and progress measures, recognizing that downstream water quality is largely determined by activities and actions on upstream lands.
This report is a product of collaboration involving multiple government and scientific contributors. Special thanks to the U.S. Geological Survey; University of Wisconsin-Madison Center for Limnology, including Honorary Fellow Richard (“Dick”) Lathrop; Wisconsin Department of Natural Resources; Public Health Madison & Dane County; Dane County Land & Water Resources Department; and the volunteer monitoring network participating in Clean Lakes Alliance’s LakeForecast program.
2025 key takeaways
The Yahara Watershed continues to face persistent water quality challenges, even as some indicators show stability or modest improvement. This year’s monitoring data reveals a mixed picture — with most lakes holding steady on key measures but notable declines in a few, alongside ongoing concerns about contaminants and the urgent need for expanded conservation efforts across the watershed. All five Yahara lakes are listed as impaired for failing to meet water quality standards. This is also true for nearly a dozen tributary streams and a similar number of beaches.
- Offshore water clarity
Most lakes received fair or good water quality rankings for offshore clarity and phosphorus levels. Lake Kegonsa was the exception as it fell from a good ranking in 2024 to a poor ranking in 2025. After many years of good clarity and phosphorus concentrations, Lake Wingra fell to a fair ranking in both categories, experiencing a one-foot loss of median clarity compared to the prior year. - Nearshore water clarity
Nearshore clarity and reported cyanobacteria blooms were close to the 2013-2025 average. Lake Monona had the highest nearshore clarity, and fewer cyanobacteria blooms were reported across the Yahara lakes compared to the prior year, with Lake Kegonsa having the highest number of bloom sightings. - Beach closures
Public Health closures of Clean Lakes Alliance-tracked beaches surpassed the 2013-2025 median. Causes were the result of high E. coli (75%), cyanobacteria (19%), or both (6%). - Chlorides & PFAS contamination
Other contaminants of concern include chlorides and PFAS. Rising chloride concentrations remain an ongoing water quality threat, with the highest levels consistently measured in Lake Wingra. Lakes Monona, Waubesa, and Kegonsa remain under fish-consumption advisories for PFOS, which is part of the PFAS family of “forever chemicals.” On a positive note, voluntary monitoring by Madison Metropolitan Sewerage District revealed PFAS levels below the regulatory threshold in treated wastewater and biosolids. - Land health progress
Continued progress is needed to reach the goal of 100% of farmland acres covered by nutrient management plans. Achieving more acreage under various conservation practices, increasing manure treatment and phosphorus exports, and removing fall leaves from city streets are among identified, Renew the Blue action priorities.
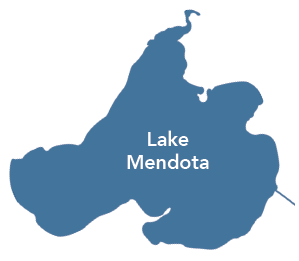
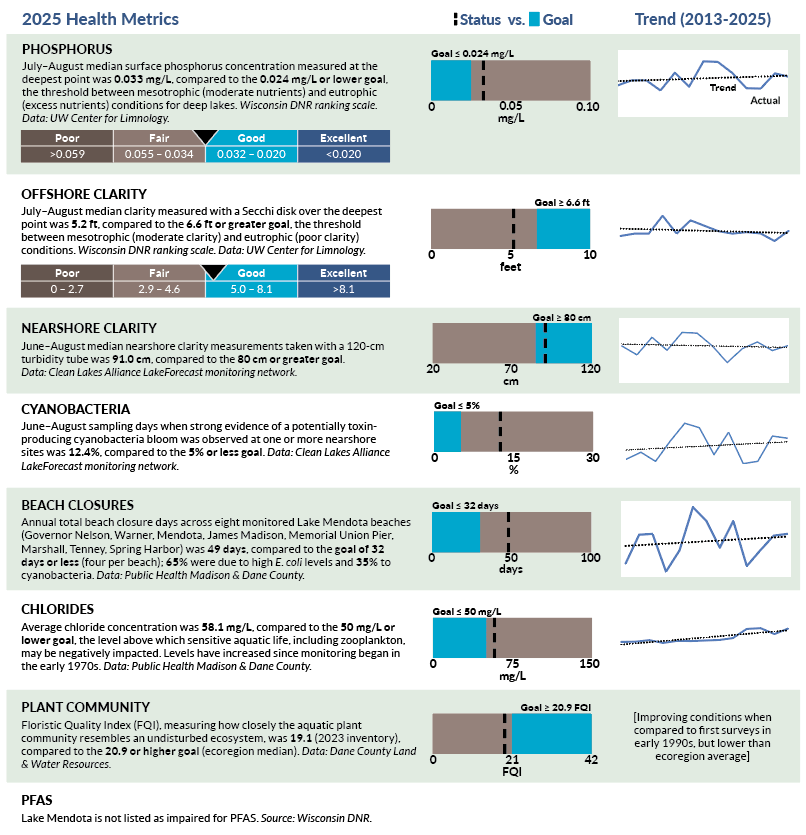
Lake Mendota
Lake Type: Drainage
Direct Drainage Area: 217 sq. miles
Total Drainage Area: 232.4 sq. miles
Surface Area: 9,847 acres
Shoreline Length: 22 miles
Mean Depth: 42 feet
Maximum Depth: 83 feet
Volume: 133,407 million gallons
Flushing Rate: 22% of volume/year
Lake Mendota is the largest of the five Yahara lakes by surface area, depth, and volume, sitting at the headwaters of the Yahara River chain. Its drainage area is predominantly agricultural. Inlet tributaries include Pheasant Branch Creek (west shore) and Sixmile, Dorn, and Token Creeks, plus the Yahara River (north shore). Water exits the southeast shore through the Yahara River to Lake Monona. The lake has been listed as impaired under the Clean Water Act for PCBs (since 1998) and for total phosphorus (since 2011).
Lake Mendota water quality dashboard
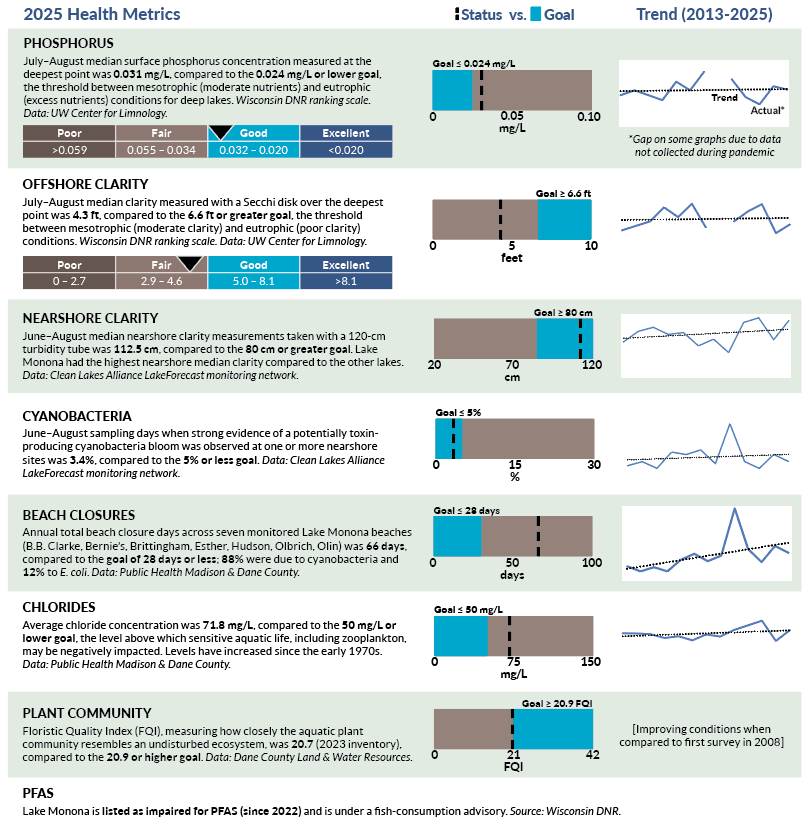
Lake Monona
Lake Type: Drainage
Direct Drainage Area: 40.5 sq. miles
Total Drainage Area: 278 sq. miles
Surface Area: 3,277 acres
Shoreline Length: 13 miles
Mean Depth: 27 feet
Maximum Depth: 74 feet
Volume: 29,059 million gallons
Flushing Rate: 91% of volume/year
Lake Monona is the second largest of the five Yahara lakes and sits immediately downstream of Lake Mendota, receiving most of its water and nutrients via the Yahara River. Its drainage area is predominantly urban, with storm sewer inputs and tributaries that include Murphy’s (Wingra) Creek (west shore), the Yahara River (north shore), and Starkweather Creek (northeast shore). Water exits the south shore through the Yahara River to Upper Mud Lake and Lake Waubesa. The lake is listed as impaired under the Clean Water Act for PCBs (since 1998), total phosphorus (since 2011), and PFAS (since 2022).
Lake Monona water quality dashboard
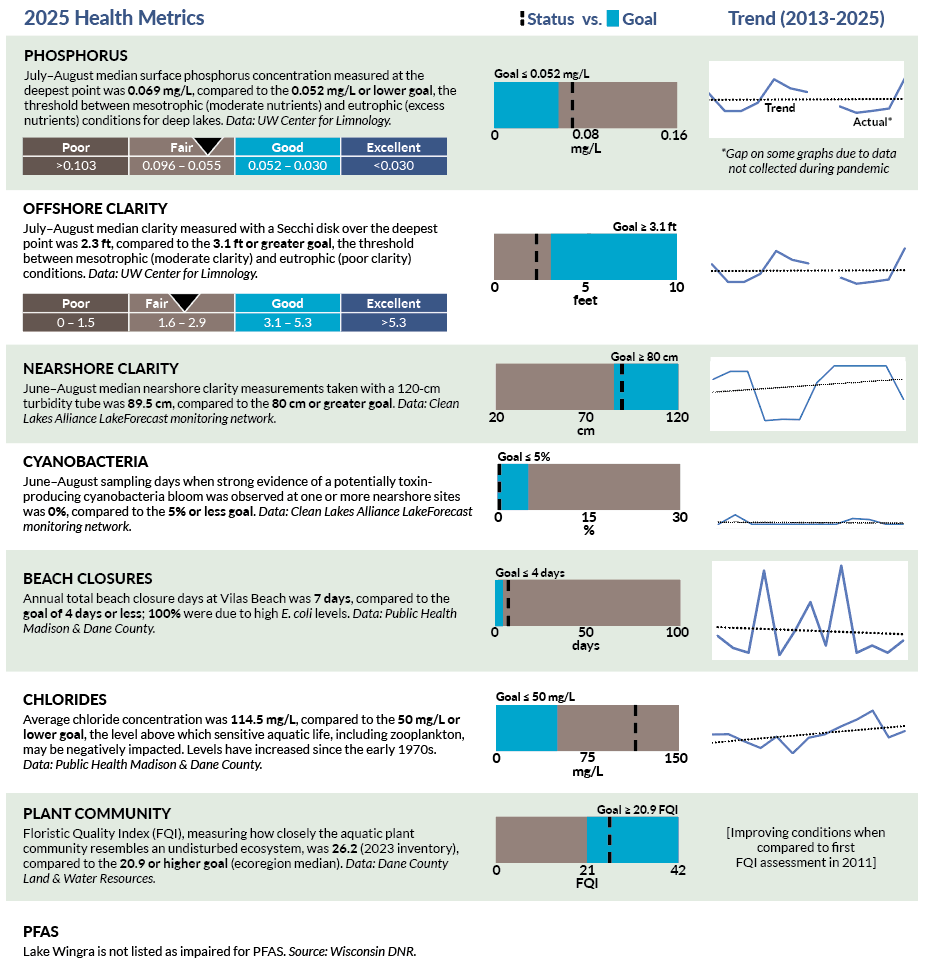
Lake Wingra

Lake Type: Drainage
Direct Drainage Area: 5.4 sq. miles
Total Drainage Area: 5.4 sq. miles
Surface Area: 321 acres
Shoreline Length: 3.7 miles
Mean Depth: 9 feet
Maximum Depth: 14 feet
Volume: 1,585 million gallons
Flushing Rate: 77% of volume/year
Lake Wingra is the smallest of the five major Yahara lakes by surface area, depth, and volume. Originally a deep-water marsh, this dredged lake now flows into Lake Monona via Murphy’s (Wingra) Creek. Its drainage area lies entirely within the city of Madison and is predominantly urban. Three minor, unnamed tributaries enter along the west and southwest shores. The lake is listed as impaired under the Clean Water Act for total phosphorus (since 2011) and PCBs (since 2012).
Lake Wingra water quality dashboard
Lake Waubesa

Lake Type: Drainage
Direct Drainage Area: 43.6 sq. miles
Total Drainage Area: 325 sq. miles
Surface Area: 2,083 acres
Shoreline Length: 9.4 miles
Mean Depth: 15 feet
Maximum Depth: 38 feet
Volume: 10,567 million gallons
Flushing Rate: 320% of volume/year
Lake Waubesa is the fourth largest of the Yahara lakes by surface area and volume. It sits downstream of Upper Mud Lake and Lake Monona. Its drainage area includes a mix of urban and rural/agricultural land uses. Inlet tributaries include Nine Springs Creek and Penitto Creek (north), the Yahara River (north shore), and Swan Creek and Murphy’s Creek (southwest shore). Most water and nutrients come from the upper lakes through the Yahara River. Water exits the east shore through the Yahara River to Lake Kegonsa. Waubesa is listed as impaired under the Clean Water Act for phosphorus (since 2011) and PFAS (since 2022).
Lake Waubesa water quality dashboard

Lake Kegonsa
Lake Type: Drainage
Direct Drainage Area: 54.4 sq. miles
Total Drainage Area: 384.6 sq. miles
Surface Area: 3,210 acres
Shoreline Length: 9.6 miles
Mean Depth: 17 feet
Maximum Depth: 32 feet
Volume: 17,700 million gallons
Flushing Rate: 220% of volume/year
Lake Kegonsa is the third largest of the Yahara lakes by surface area and volume. It sits downstream of Lake Waubesa and Lower Mud Lake. Its drainage area is predominantly rural/agricultural. Inlet tributaries include the Yahara River and Door Creek (north shore), and two unnamed creeks (southwest and northeast shore). Most water and nutrients come from the upstream lakes through the Yahara River. Water exits the east shore through the Yahara River toward the Rock and Mississippi Rivers. Kegonsa is listed as impaired under the Clean Water Act for total phosphorus (since 2011) and PFAS (since 2022).
Lake Kegonsa water quality dashboard

Water quality indicators
The State of the Lakes assesses five areas of interest that represent vital, interconnected pieces of the larger water quality puzzle. Illustrated in Figure 2, they include both outputs (i.e., land-use actions taken) and outcomes (i.e., measured water quality responses). Each was chosen to illustrate critical cause-and-effect principles that play out as water interacts with and gets funneled through the watershed.
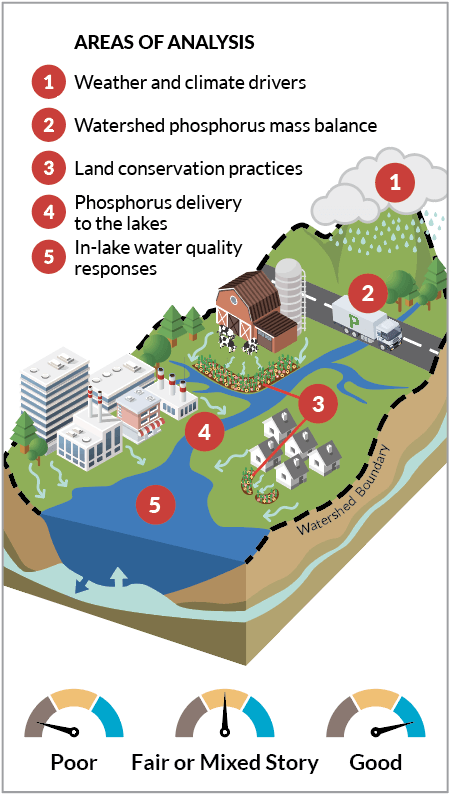
The availability and movement of phosphorus are central themes given its dominant role in affecting overall lake conditions. Although a natural element essential for plant and animal growth, it can easily harm water quality due to excess supply and poor management. Sources of phosphorus can include eroded soil particles, fertilizer runoff, leaf debris in city streets, livestock manure, sewage releases, and uncollected pet waste. A common rule of thumb is that it takes only one pound of phosphorus to generate up to 500 pounds of wet algae growth.
1. Weather and climate drivers
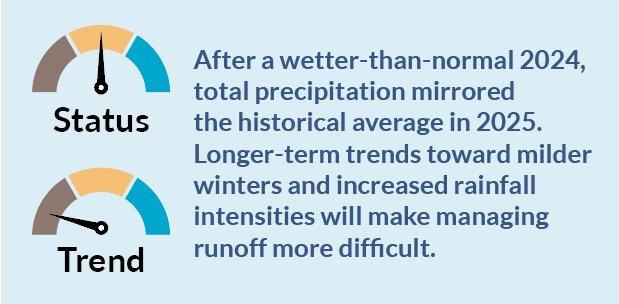
The Wisconsin State Climatology Office confirms that the past two decades have been the state’s warmest on record, and the 2010s was Wisconsin’s wettest decade. Regardless of whether it is a change in average temperature, precipitation, ice cover, or some other factor, lakes dynamically respond to their environment. Regional heating and cooling patterns influence what types of aquatic organisms can thrive, how and when the water column mixes, and the timing and magnitude of annual freeze cycles. Meanwhile, the timing, intensity, and amount of rainfall over the watershed determine what can get moved from the land surface into downstream receiving waters, including phosphorus-containing materials that fuel algal growth and turn the lakes green.
Ice Cover
Winter ice conditions and the timing of ice-off influence everything from a lake’s thermal properties to the reproductive success of its aquatic life. Ice quality and overlying snow depth affect how much sunlight can penetrate to warm the water column and facilitate dissolved oxygen production through photosynthesis. As ice-off dates move earlier due to climate change, resulting impacts can range from poorer walleye reproduction to more intense algal blooms.
Winter temperatures heading into 2025 were warmer compared to the long-term average, contributing to a relatively short ice season. During the 2024–2025 winter, lakes Mendota and Monona had 69 and 79 days of ice cover, respectively — both well below their 102-day historical averages. This continues a trend toward shorter ice seasons in recent decades. Earlier ice-out dates and below-average ice cover durations align with broader patterns of increasing winter temperatures in our region. Shorter and warmer winters lead to warmer lake temperatures earlier in the year, effectively creating a longer growing season for algae and aquatic plants. Warmer winters can also contribute to greater runoff and phosphorus delivery when wet precipitation falls on frozen soils. Rather than soak into the ground, rainfall more easily turns into runoff that can carry land-spread manure and other contaminants into the ditches and streams that drain to the lakes. It is estimated that, on average, nearly half of the total phosphorus loading through Lake Mendota’s monitored stream tributaries occurs from January to March, making late winter and early spring a vulnerable time for our lakes.

Precipitation
A total of 36.41 inches of precipitation fell across the watershed during the 2025 “water year” (Oct. 1 –
Sep. 30). This is a 22% decrease over the prior year’s wetter-than-normal 46.45 inches and less than an inch shy of the historic normal. Water years are used to align data collection with the natural cycle of water accumulation and runoff. This 12-month period ensures that winter snow cover is counted alongside the rain that fed it, providing accurate, consistent annual data for managing water resources.
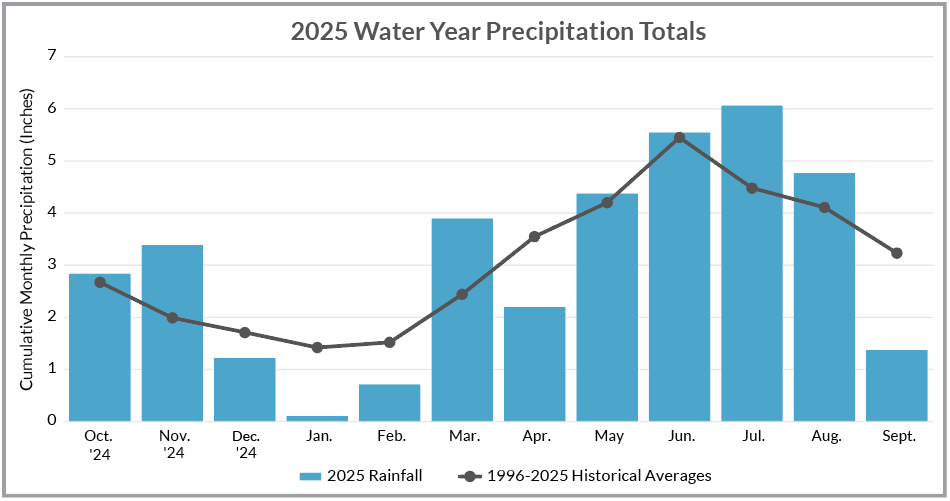
The winter season, particularly January – March, brings the highest levels of phosphorus loading to our lakes, often resulting in increased blooms and aquatic plant growth during the summer season. As much as 37-48% of phosphorus loading occurs during this three-month period based on long-term stream gaging data collected by the U.S. Geological Survey.
While spring and summer rainfall totals were close to historical averages, it’s worth noting that May, June, July, and August each recorded at least one day with rainfall exceeding one inch, and some over two inches within a 24-hour period. These large events contribute to increased soil erosion and stormwater runoff throughout the watershed, impacting water clarity and algal bloom frequency.
2. Watershed phosphorus mass balance
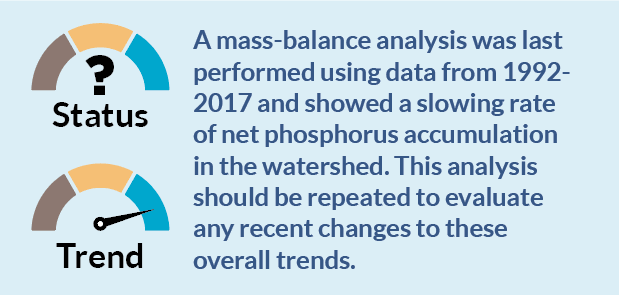
The difference between the mass of phosphorus entering (imported into) and leaving (exported from) the watershed tells us whether the net balance is trending in the right direction. The movement and fate of livestock, feed, fertilizer, harvested crops, animal waste, and other phosphorus sources are factored into the analysis. The goal is to attain a negative balance, indicating more phosphorus is being exported than imported on an annual basis. This situation reduces the overall availability of phosphorus from being able to reach area waterways.
Conversely, a positive balance signals an annual net accumulation of phosphorus in the watershed, usually leading to its gradual buildup in area soils. Phosphorus-saturated soils subject to erosion from disturbance or a lack of year-round plant cover can eventually end up at the bottom of nearby lakes and streams. Phosphorus is also more easily “leached” (or released in dissolved form) from these soils when they encounter rainwater and snowmelt.

Past improvements to the overall mass balance are attributed to multiple factors. They include decreases in imported commercial fertilizer, less phosphorus-containing feed supplements consumed by livestock, exported byproducts of manure digestion, and advanced phosphorus-management strategies implemented by Madison Metropolitan Sewerage District (among others). Examples of mass balance detractors include increases in livestock numbers and milk production that result in more manure being generated.
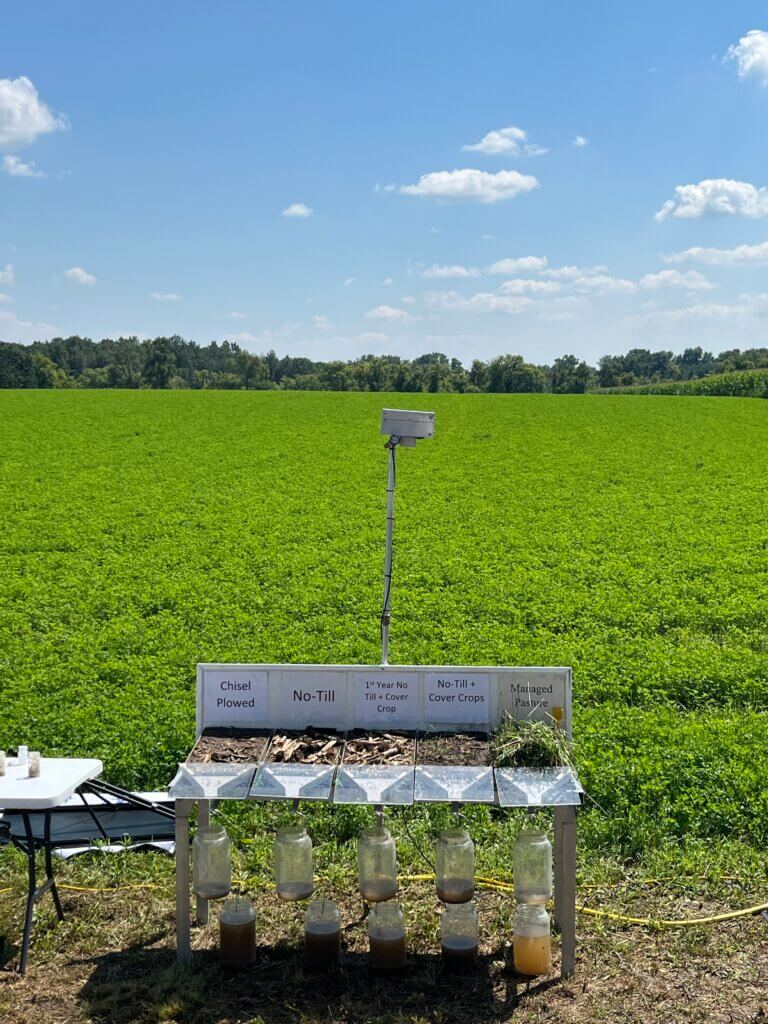
3. Land conservation practices
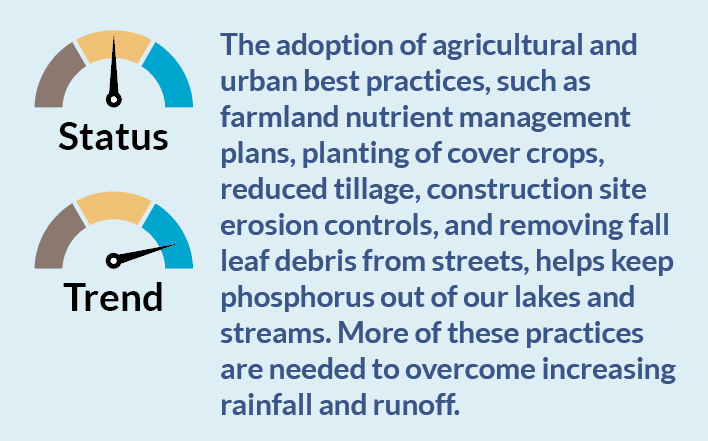
The implementation of conservation practices is critical in our efforts to improve water quality. Perennial grasslands, vegetative buffers, cover crops, and rotational grazing are examples of land-stewardship practices that protect soils and reduce the amount of soil and nutrient runoff reaching nearby surface waters.
Another recommended practice is the implementation of nutrient management plans. Nutrient management plans are a tool that allows farmers to evaluate different cropping, tillage, and nutrient applications (i.e., fertilizer and manure spreading) to support strong yields while reducing runoff risk. They also help inform nutrient-application decisions, reducing the potential for nitrates to contaminate drinking water aquifers. In the Yahara Lakes Watershed, UW-Madison Extension reporting shows that between 16-29% of private wells are currently exceeding the 10-mg/L health standard.

Records filed with Dane County Land & Water Resources in 2025 indicate that 46,039 out of 81,253 total agricultural acres within the Yahara Lakes Watershed (56%) were mapped as having a nutrient management plan. This represents a 3% increase over what was reported in 2024. Since Dane County does not receive plans from every farm on an annual basis, the reported percentage of agricultural land having a nutrient management plan is likely to be considerably higher but still short of the goal of having all acres covered.
A key environmental metric within nutrient management plans is the Rotational Average Phosphorus Index (PI), representing estimated pounds of phosphorus loss per acre per year. The higher the PI value the greater the risk for phosphorus to reach surface waters. State standards require all agricultural fields to have a PI of 6 or less. However, based on modeling summarized in RENEW THE BLUE: A Community Guide for Cleaner Lakes & Beaches in the Yahara Watershed (2022), a Rotational Average PI of 2.1 or less is needed to reach phosphorus loading targets and water quality goals. Based on information from nutrient management plans submitted in 2025, the average PI for fields within the Yahara Lakes Watershed was 2.3, or a one-tenth reduction compared to the prior year.
4. Phosphorus delivery to the lakes

Most phosphorus is delivered to the Yahara lakes through tributary streams that collect and funnel upland-generated runoff as it moves downhill. How much is transported depends on the seasonal timing and intensity of runoff events, the location and availability of major phosphorus sources, and measures taken to contain those sources and manage runoff.
Stream monitoring helps assess how conservation practices, land-use changes, and shifts in weather or climate influence phosphorus loading. Loading describes the total mass of phosphorus entering a water body over a specific period. In our case, we characterize loading in pounds of phosphorus (calculated by multiplying in-stream concentrations by streamflow) delivered to Lake Mendota through its monitored stream tributaries in a given water year.

Perched at the top of the chain and receiving most of the drainage from the Yahara Lakes Watershed, the condition of Lake Mendota offers a good indicator for how the downstream lakes will be impacted. Lake Mendota is also the largest lake with the greatest number of monitored streams and the most complete long-term dataset. Most of the phosphorus received by the lower lakes in the chain is through the outlets of the upper lakes as it cascades through the system.
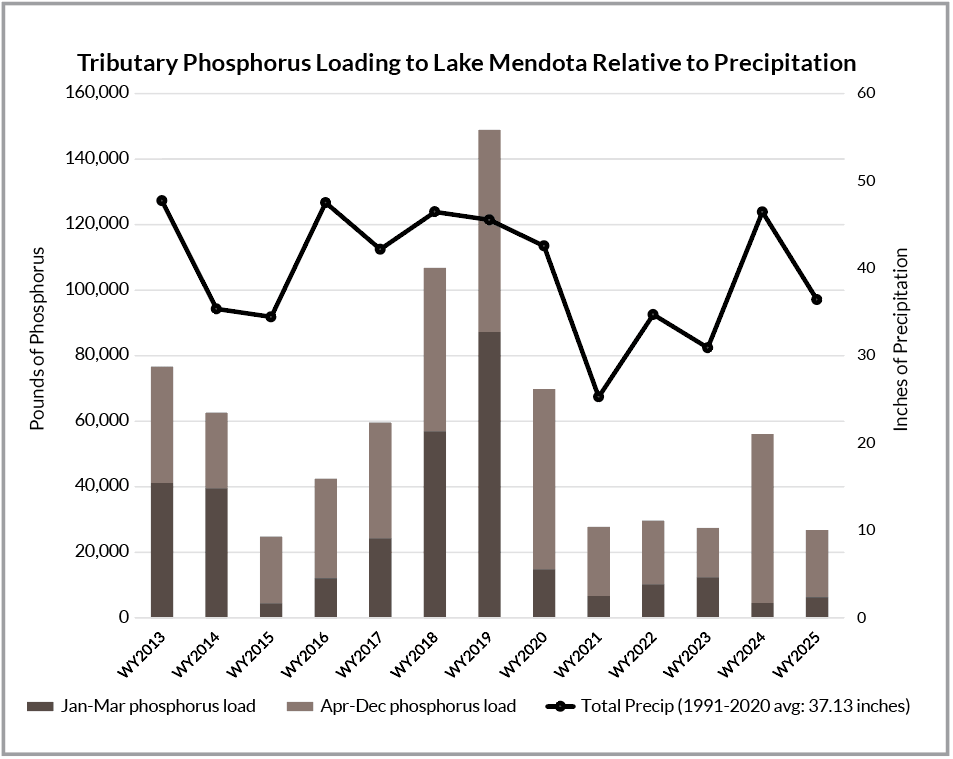
Figure 4 shows stream-monitored phosphorus loading since 2013. Total precipitation is also plotted to distinguish between wet and dry years. From 2021-2023, average annual phosphorus loading to Lake Mendota was comparatively lower, dipping slightly below the water quality target level (approximately 32,600 lbs.). This was largely due to the three-year period of drier weather that followed years of above-average precipitation, reducing the amount of runoff able to transport phosphorus to the lakes. Favorable phosphorus-loading conditions were repeated in 2025. Scientists estimate that, on average, the number of summer algal-bloom days can be cut in half if these lower levels can be maintained.
5. In-lake water quality responses
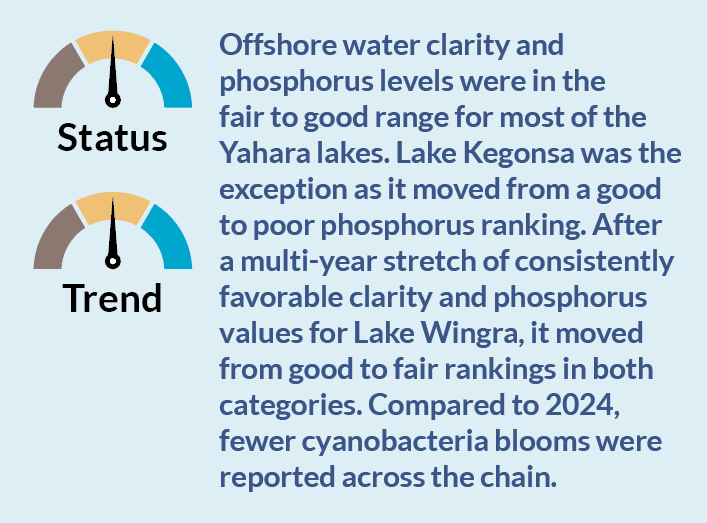
Several in-lake metrics are used to assess overall lake health and track changes over time. Those metrics include water clarity, phosphorus concentration, presence of cyanobacteria (blue-green algae) blooms, and beach closures. Each is summarized in the following sections. Apart from Lake Wingra and Lake Kegonsa, the other Yahara lakes improved slightly in phosphorus and offshore clarity compared to 2024.
Phosphorus
In-lake phosphorus concentrations fell or remained relatively unchanged in all the lakes except for Lake Wingra and Lake Kegonsa (Figure 5). No obvious trends are evident in any of the lakes when looking at longer time horizons.

After Lake Mendota’s post-turnover phosphorus concentrations hit record lows in 2022 and 2023, a much wetter 2024 saw these positive effects start to disappear before improving again in 2025. Turnover occurs when deeper lakes cool to the point where the water column can completely mix. Higher phosphorus concentrations that have built up throughout the summer in the lake’s bottom waters are then mixed throughout the lake. When less phosphorus enters the lake from the watershed, the bottom-water buildup of phosphorus is reduced, thereby reducing internal (in-lake) sources that can fuel algal growth the following year.
According to UW Center for Limnology Honorary Fellow Richard Lathrop, “Fall-turnover phosphorus concentrations were especially low in 1988, 2012, and 2023 following those extended drought periods. Fifty years of post-turnover monitoring data confirm that Lake Mendota’s phosphorus levels decline when watershed sources are reduced, resulting in significant and relatively quick water quality improvements.”
Water Clarity
Offshore water clarity improved by roughly a foot over the prior year for all of the Yahara lakes except for Lake Wingra (Figure 6). In fact, Lake Mendota experienced a prolonged, spring clear-water phase with record-setting clarity readings. Lake Wingra, on the other hand, had a year defined by extremes, starting with high clarity early in the season before dropping to less than two-foot clarity readings in August. A short clear-water phase in the spring was followed by low clarity readings not seen since before a successful carp-removal project in 2008. Because Lake Wingra fish sampling by UW Center for Limnology did not show new carp recruitment, the loss of clarity was likely due to a surge of nutrients entering through storm sewers following one or more summer runoff events.

Because water clarity often varies across a given lake, Clean Lakes Alliance uses a network of trained monitors to collect additional data through its LakeForecast program. From Memorial Day through Labor Day, monitors submit at least twice-weekly reports on water clarity, water temperature, and the severity of observed green algae and cyanobacteria blooms (among other variables). A total of 1,755 condition reports were submitted in 2025. These reports allow lake users to stay aware of ever-changing nearshore conditions. They also help scientists better understand how water quality responds to environmental change occurring both in the outlying watershed and within each lake itself.
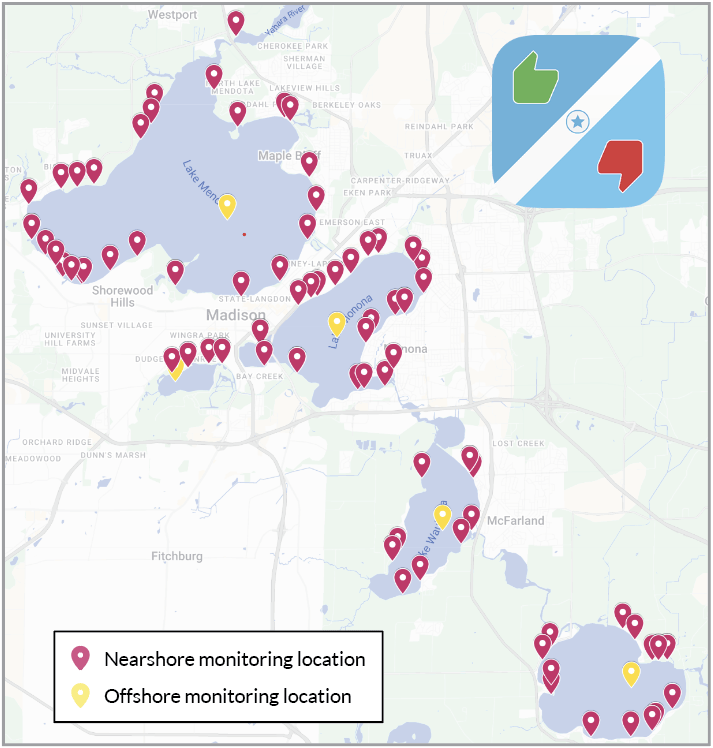
Nearshore clarity is measured by LakeForecast monitors using a turbidity tube to report conditions at 79 sites spanning all five lakes (Figure 7). Figure 8 shows the median summer (Jun-Aug) clarity readings for each lake from 2014-2025. Values under 50 centimeters are considered “murky,” between 50-80 “fair,” and between 80-120 “good.” Figure 9 shows how nearshore clarity by lake changed as the 2025 sampling season progressed.
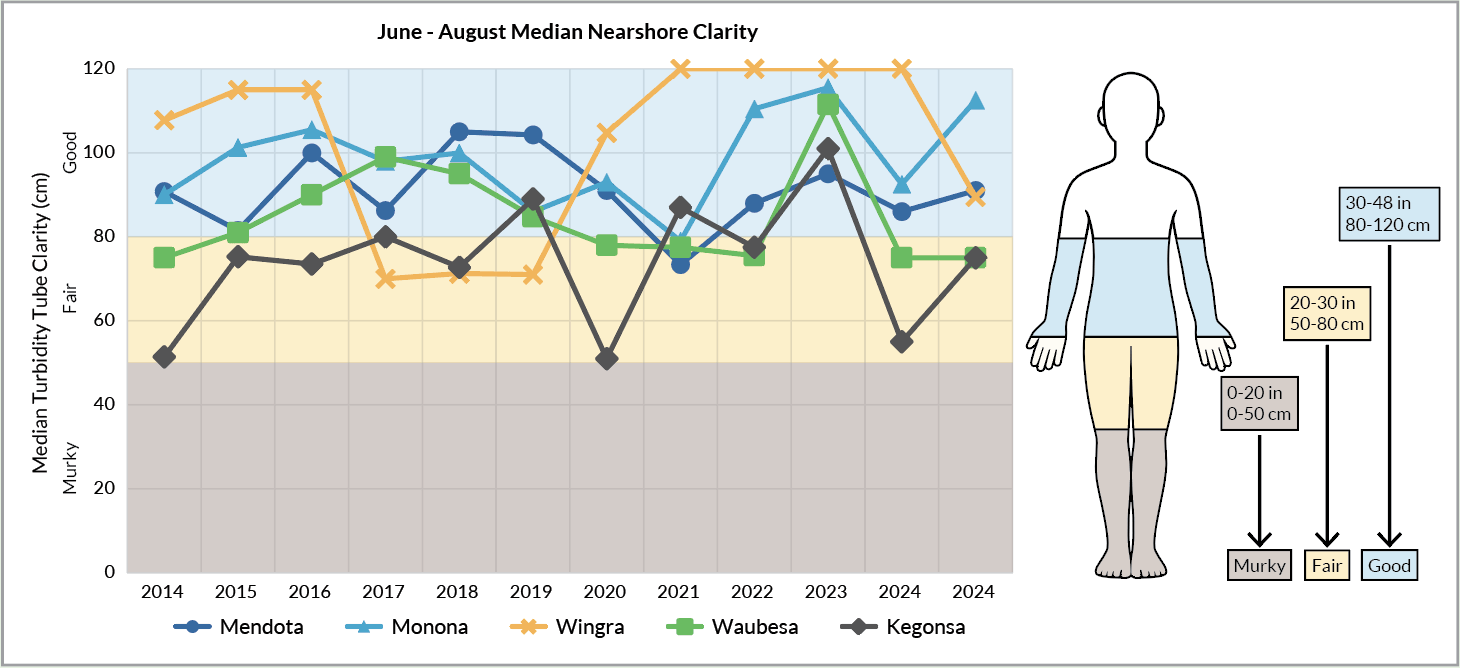
Values for 2025 remained within the fair to good range. Lake Monona had the highest median nearshore clarity while Lake Waubesa and Lake Kegonsa had the lowest. Comparing nearshore to offshore findings highlights how clarity can vary over both time and space within individual lakes, and why both assessments are provided in this report.
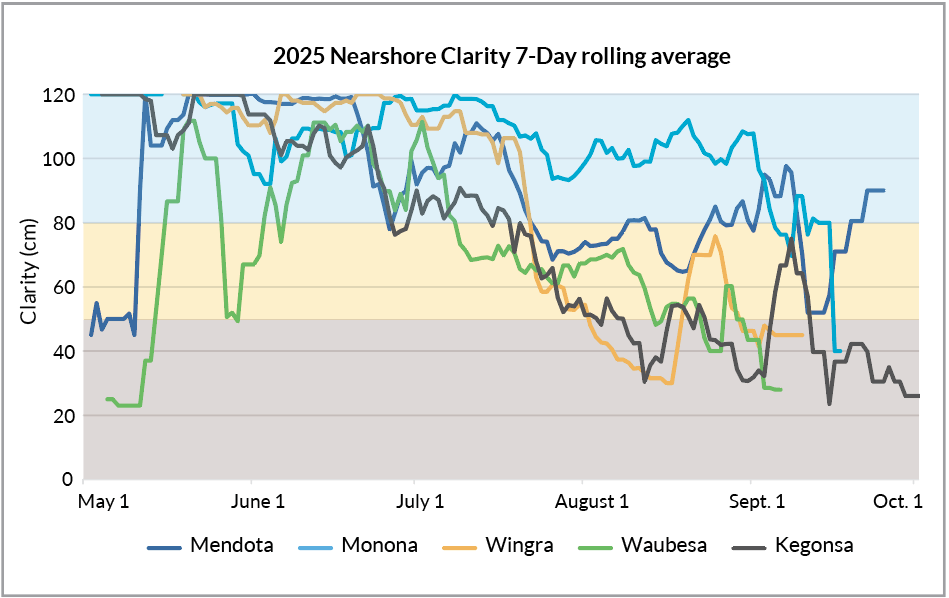
Water clarity usually diminishes as the season unfolds. In spring, cooler water and an abundance of native zooplankton suppress algae growth, favoring clearer water. Zooplankton numbers decline as the summer progresses due to increased water temperature and predation by young fish, reducing this natural grazing pressure on algae. At the same time, sunlight and heat stimulate algae growth, especially when nutrients like phosphorus are plentiful. Increased boating activity can also stir up bottom sediments in shallow areas, further decreasing clarity. By mid- to late summer, the combined effects of reduced zooplankton grazing, higher algae growth, and sediment-resuspending recreational activities often turn lakes murkier compared to earlier in the season.
Cyanobacteria Blooms
To determine cyanobacteria bloom frequency, the number of days on each lake with at least one report of a strong cyanobacteria bloom observed within the monitoring sites was counted. By dividing the number of “cyanobacteria bloom days” by the total number of sampling days for each lake, a percentage is generated representing how often the monitors observed at least one major bloom within their nearshore sampling area. This method lessens overreporting in situations when different monitors report the same cyanobacteria bloom.
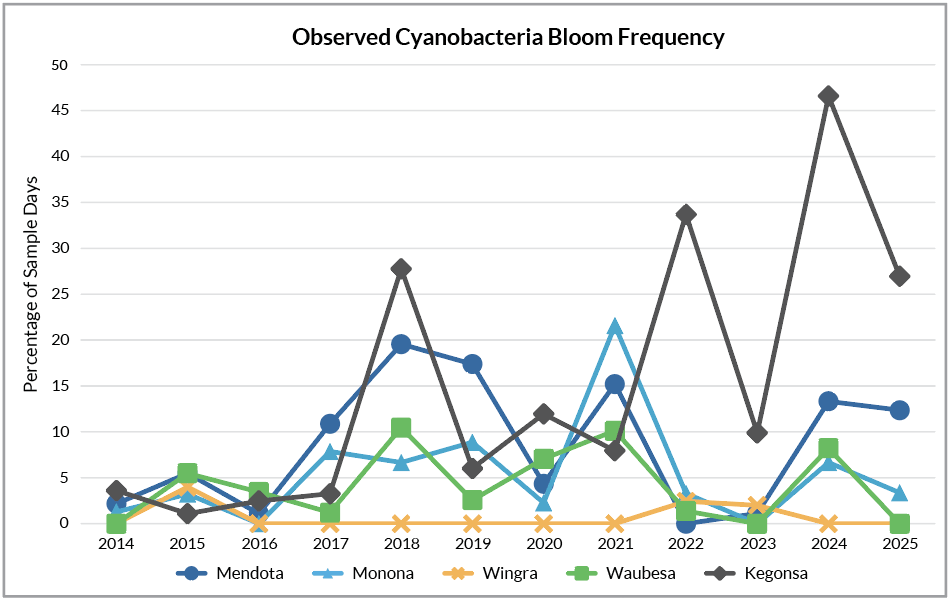
Figure 10 shows the percentage of sampling days when strong evidence of a cyanobacteria bloom was observed on each lake (2014-2025). Overall, monitors reported fewer cyanobacteria blooms, with every lake experiencing a reduction in reported cyanobacteria blooms compared to 2024.
Lake Kegonsa continued to report the highest frequency of blooms, with over 40% of sampling days having significant evidence of a surface bloom reported during the month of August. Lake Mendota saw the second-highest numbers, with August being the worst month for surface blooms. Both lakes Mendota and Kegonsa saw bloom frequencies increase as the sampling season progressed, while Lake Monona experienced the opposite trend. Monitors on Lake Wingra and Lake Waubesa did not report a single, significant bloom from June 1st to August 31st.

Beach Closures
Beach closures are another useful indicator of general lake health. Clean Lakes Alliance looks at closure data provided by Public Health Madison & Dane County for 17 beaches (Figure 11). Covering four of the five Yahara lakes, these tested public beaches were selected for analysis due to the consistency of tracking data over the reporting period. Results are reported as total closure days recorded for each season, roughly running from Memorial Day to Labor Day. For example, if two beaches on a given lake are closed for a total of five days each, 10 closure days would be reported for that lake.
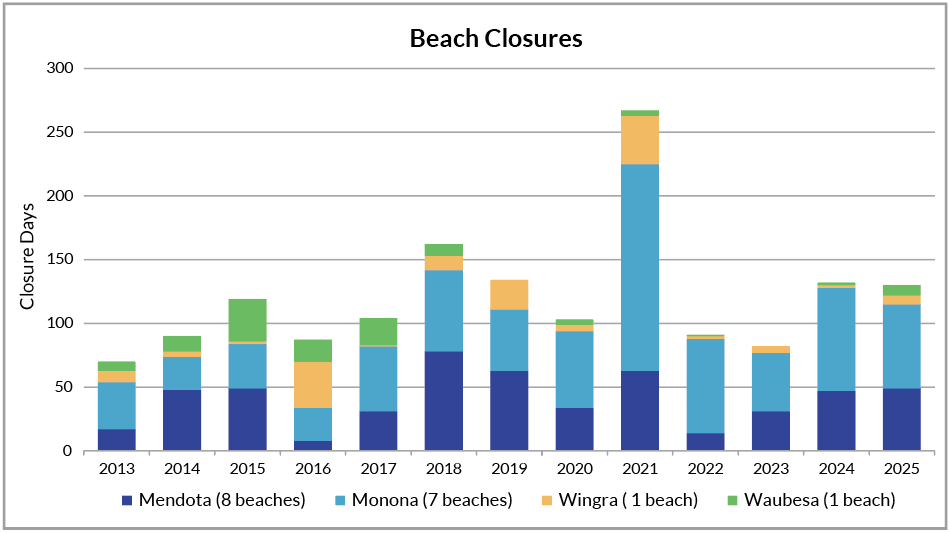
Closures are most often the result of high cyanobacteria and/or E. coli bacteria levels, with closure rates strongly influenced by timing and frequency of testing. Beaches are generally tested once per week and then daily for those with a closure in effect. Cyanobacteria blooms, which are often a product of high lake fertility (caused by an oversupply of nutrients like phosphorus), can be dangerous due to the bloom’s potential to release toxins that can harm people, pets, and wildlife. High E. coli concentrations can also be harmful as they are an indicator of human or animal fecal matter in the water that may contain dangerous pathogens. E. coli often enters beach areas via nearby storm sewer outfalls and waterfowl feces.
There were 130 closure days among the beaches tracked for this analysis. This was comparable to 2024 and surpasses the median of 104 closure days since 2013. Closures were caused by E. coli (81%) and cyanobacteria (19%). Beaches closed exclusively due to E. coli were James Madison, Marshall, and Spring Harbor on Lake Mendota, Esther and Olin on Lake Monona, Vilas on Lake Wingra, and Goodland County on Lake Waubesa. Beaches closed exclusively due to cyanobacteria were Warner and Tenney on Lake Mendota, and B.B. Clarke on Lake Monona. The remaining tracked beaches — Bernies, Brittingham, Hudson, and Olbrich on Lake Monona — were closed due to both E. coli and cyanobacteria.
The story of 2025
The 2025 State of the Lakes tells a story that is both encouraging and cautionary. Favorable runoff conditions and below-average winter precipitation helped reduce phosphorus delivery during the critical January–March period, contributing to fair to good offshore clarity and phosphorus levels in most of the lakes. Compared to 2024, fewer cyanobacteria blooms were reported across the chain, and most lakes saw modest improvements in summer clarity. These results reinforce what decades of data continue to demonstrate: when phosphorus loading declines, the lakes can respond favorably, quickly, and measurably.
At the same time, significant challenges persist. All five Yahara lakes remain listed as impaired for phosphorus, with additional impairments for PFAS (commonly referred to as forever chemicals) and other contaminants impacting their health and usability. Rising chloride concentrations linked to winter deicing practices continue to trend upward. Beach closures remain elevated compared to long-term medians, driven primarily by elevated levels of E. coli and cyanobacteria. Lake Kegonsa’s increase in phosphorus and bloom frequency underscores how fragile gains can be when watershed conditions shift.
The watershed indicators provide important context. Nutrient management plans cover just over half of agricultural acres in the watershed, and the average Phosphorus Index value remains above what modeling suggests is needed to consistently meet water quality goals. Climate trends toward warmer winters, shorter ice seasons, and more intense rainfall events further complicate progress. Even in a year of near-average precipitation, high-intensity storms can still deliver large pulses of runoff and phosphorus into the lakes.
Cleaner lakes begin uphill
The story of water quality change is why the action framework outlined in RENEW THE BLUE: A Community Guide for Cleaner Lakes & Beaches in the Yahara Watershed (2022) remains so essential. Priority recommendations include direct-impact actions that measurably reduce phosphorus loading at its source:
- Build additional manure-processing capacity.
Support farmers in using existing manure-processing facilities or to build their own on-farm systems. Pilot a manure-collection and processing program targeting the critical January-March period with the highest overall phosphorus loading. - Increase the ability to handle and transport manure.
Use composting and other processing techniques to allow for improved timing and targeting of applications. Minimize chemical fertilizer use by substituting with composted manure or other sources of crop nutrients generated within the watershed. - Increase farmland acres guided by a nutrient management plan.
Use plans to improve operational decision-making, ensure the most efficient use of costly nutrient inputs, and reduce the risk of phosphorus loss. - Increase farmland acres under no-till (or reduced tillage) and continuous living cover.
Limit soil disturbance and maintain a living root in the soil with cover/forage crops, harvestable buffer strips, overwintering hay, etc. to build better soil health and reduce erosion. - Increase municipal street-cleaning miles and frequency during fall.
Regularly remove leaf litter from streets to prevent rainwater-leached phosphorus from entering storm sewer systems. - Protect internally drained lands and wetlands.
Use closed depressions (accounting for an estimated 41% of the watershed) to naturally retain and absorb runoff. Maintain and restore wetland function to achieve similar benefits. - Increase green-infrastructure installations in parks, new developments, and on existing residential and commercial properties.
Incorporate nature-based solutions such as rain gardens, bioswales, infiltration trenches, and permeable pavement to capture, absorb, and filter runoff. Use tools such as stormwater utility credits, rate adjustments, and recognitions to reward action.

The actions described above directly capture or reduce phosphorus before it reaches streams and lakes. Equally important are the priority indirect-impact actions that enable and accelerate implementation at scale:
- Continue to work together as Yahara CLEAN Compact members.
Maintain ongoing member meetings to collaborate on recommended actions, report progress, and coordinate around new initiatives. Ongoing collaboration should consider how actions might affect the watershed phosphorus mass balance, among other factors. - Increase participation in producer-led watershed groups.
Expand farmer involvement in conservation planning and practice adoption through continued learning, information sharing, and distribution of cost-share incentives. - Complete an inventory of shoreline and beach conditions.
Establish guidelines and criteria for the sustainable design, development, management, and restoration of shorelines and public beaches. - Increase E. colitesting at public beaches.
Focus efforts on beaches shown to be most susceptible to problems. Assess E. coli bacteria sources at beaches with high closure rates so corrective measures can be taken. - Continue to track and report progress.
Use and support the annual State of the Lakes report as a means of outreaching to the community. Support continued maintenance and operation of stream-gaging stations that track changes in phosphorus loading.
Together, these recommendations reinforce three essential truths. First, phosphorus management remains the most powerful lever for improving lake health. Second, weather variability can either accelerate or undermine progress, making runoff-reducing strategies increasingly vital. Third, sustained improvement requires both on-the-ground implementation and support systems that make those efforts scalable and permanent.
The path forward is clear but requires sustained commitment. Expanding nutrient management plan coverage to all agricultural acres, accelerating adoption of conservation practices, reducing winter salt spreading, enhancing manure treatment capacity, and strengthening urban stormwater controls are among the actions that will move us in the right direction. And by repeating the watershed phosphorus mass balance analysis and investing in continued stream-gage monitoring, it will be possible to evaluate how well collective actions are translating into long-term, measurable results.
The Yahara lakes are dynamic systems that display an ability to recover under favorable conditions. Periods of lower phosphorus loading in recent years have demonstrated that clearer water, fewer cyanobacteria blooms, and measurable ecological improvement are possible. With science-guided action, community engagement, and informed policy decisions, these improvements can become the rule rather than the exception.
Putting stewardship values to work
Ultimately, lakes mirror their watersheds, reflecting the condition of the lands that drain to them. When soils are protected and biologically thriving, water infiltrates and is filtered. When landscapes are hardened by pavement and rooftops, rainfall turns to runoff, collecting contaminants and delivering them downstream.
Roads, parking lots, and compacted soils increase stormwater volume and velocity, intensifying erosion and nutrient transport. To offset these impacts, expanding green infrastructure in cities and neighborhoods is essential. Rain gardens, bioswales, permeable pavements, restored wetlands, and urban tree canopies help absorb rainfall where it lands. At the same time, building dense, efficient land use conserves more land for parks and conservation areas to help protect infiltration capacity and minimize runoff.
In rural areas, one of the most pressing watershed challenges is the excess manure produced in livestock-dominated regions. Increasing manure treatment capacity, reducing commercial fertilizer imports, and improving application timing and methods are critical strategies for reducing surplus phosphorus. Where soils are already enriched, careful management is necessary to prevent dissolved phosphorus from leaching or being washed into streams during snowmelt and heavy rain.
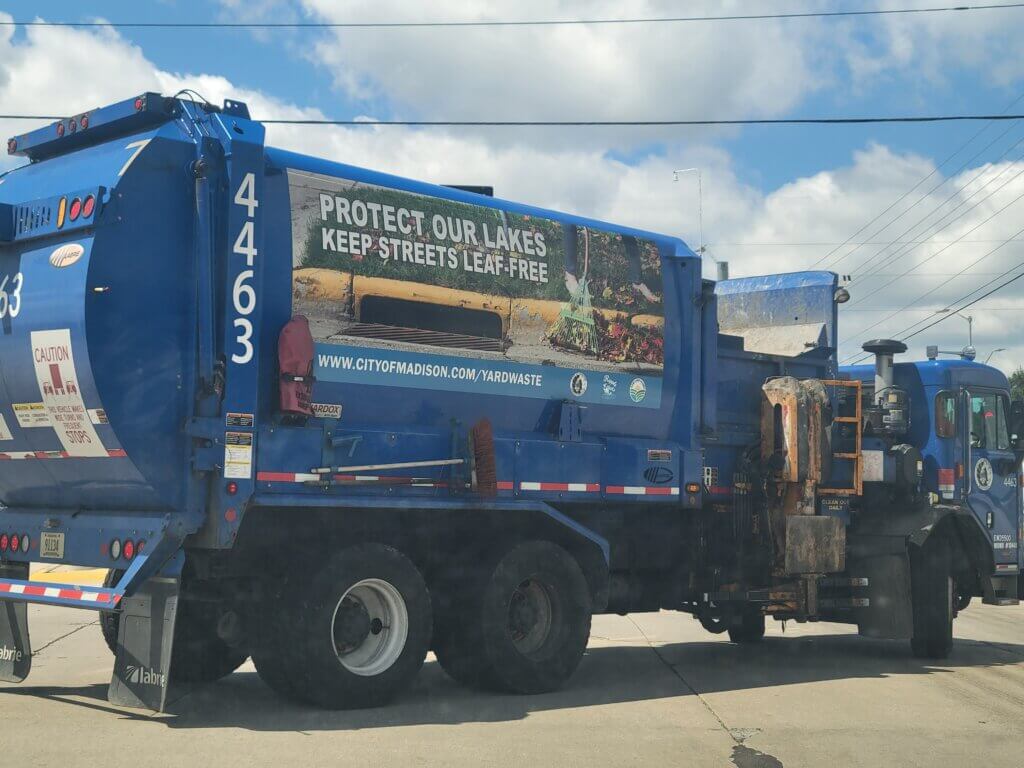
In urban settings, fall leaf debris represents one of the largest seasonal sources of phosphorus entering local storm drains. Street gutters filled with decomposing leaves can release significant nutrient loads during each rain event. Effective leaf-removal programs combined with public education campaigns offer high-impact opportunities to address the sources and pathways of phosphorus that threaten our lakes.

Watershed under pressure
The 385-square-mile Yahara Lakes Watershed is home to a mix of urban, suburban, and agricultural landscapes. Estimates have placed its population at more than 370,000 people, including the cities of Madison, Sun Prairie, Middleton, Monona, and neighboring towns and villages that lie fully or partially within the watershed boundary.
This population is the result of substantial growth over recent decades, mirroring trends in Dane County as a whole, which has seen above-average increases since the 1970s. The county’s total population rose from about 488,000 to more than 560,000 from 2010-2020, and local planning projections estimate it could reach nearly 887,000 by 2050 (a 58% increase). Communities within the watershed are among the County’s fastest growing, meaning a large share of future population growth will continue to occur in areas that are most directly connected to the lakes.
Population growth matters because it influences land use patterns, development intensity, and infrastructure needs. In the absence of thoughtful planning, such growth can lead to the unnecessary hardening of the landscape (more pavement, roofs, and compacted soils), which accelerates stormwater runoff, reduces infiltration, and increases the transport of nutrients and sediments to lakes and streams.
Urban expansion has nearly doubled developed land area in the watershed since the 1970s. Dane County analyses show that the total urbanized acreage in the watershed grew from roughly 41,000 acres to about 71,000 acres over the last 50 years, a more than 70% increase, and the County’s population is projected to grow substantially through 2050. To accommodate this growth, efficient and compact development coupled with enhanced green infrastructure will be necessary to minimize runoff volumes.
Because the watershed includes both dense urban areas and productive agricultural land, population and development pressures are impacting the lakes in complex ways. Urbanization typically increases impervious surfaces and stormwater volume, while agricultural growth can influence nutrient balances through manure production and the use of imported commercial fertilizers. Growth trends highlight the need for planning and practices that protect soils and absorb runoff before it reaches surface waters.

A year of land health progress
New plan guides native plant restoration across Madison’s stormwater system
Madison’s Stormwater Utility Section adopted a citywide Vegetative Management Plan to guide how vegetation is managed across more than 1,500 acres of stormwater ponds, greenways, and wetlands. The plan emphasizes restoring native plant communities, strengthening biodiversity, and improving climate resilience while maintaining the essential stormwater functions these areas provide.
Native vegetation plays an important role in reducing flood risk, improving water quality, and allowing more water to soak into the ground. One strategy already in motion requires stronger native planting standards in developer agreements for private projects that include ponds and greenways. Over time, the plan is expected to expand habitat for pollinators and help the city better respond to heavier rainfall and other extreme weather conditions.
Continued watershed-scale adaptive management
Yahara WINS again served as an influential driver for phosphorus reduction and collaborative watershed action in 2025. This long-term adaptive management initiative brings together utilities, farmers, municipalities, and conservation partners to implement practices that reduce phosphorus going into area lakes and streams. In 2024 alone, partner efforts under Yahara WINS prevented more than 59,000 pounds of phosphorus from reaching waterbodies. That legacy of practice implementation carried forward into 2025 with continued collaboration, cost-share support, and treatment practice deployment.
Yahara WINS also approved funding to conduct a multi-year prioritization study. The study will use geospatial analysis to identify where phosphorus-reducing practices are most needed and likely to be effective across stream reaches. This effort supports targeted implementation and maximizes the impact of limited resources.
Stream restoration
Dane County’s Land & Water Resources Department is helping to improve water quality in the watershed through long-term, targeted land conservation. A major milestone is the completed restoration of roughly three miles of Door Creek, including re-meandering the stream and reconnecting it to adjacent wetlands. This project reflects more than 30 years of work in the Door Creek sub-watershed.
Earlier studies identified Door Creek and nearby wetlands as critical natural resources worth protecting. The County has since worked with local landowners and partners to address areas prone to soil and nutrient loss. This focus is especially important because Door Creek was identified as the second-largest nonpoint-source phosphorus contributor in the watershed. Conservation practices implemented over time include 9.5 miles of stream buffers along Little Door and Door Creeks, restoration of 180 acres of prairie, and more than 50 additional projects aimed at reducing phosphorus runoff.
Monitoring and reporting
Clean Lakes Alliance continued coordinating water quality monitoring across the Yahara lakes, reporting on cyanobacteria blooms, beach status, and water clarity through LakeForecast.org. This information, produced by citizen scientists, improves community awareness and helps direct attention and resources toward areas of concern. Other volunteer-run efforts include Rock River Coalition’s stream monitoring and those of various Friends groups and watershed associations.
Stream gages operated by the U.S. Geological Survey remain instrumental to assessing the impacts of watershed change over time, including resulting phosphorus loads to downstream waterways. Many of these gages have been collecting discharge and water quality information for decades. Unfortunately, the long-term funding situation for these gages is in question, jeopardizing critical datasets that lead to informed management decisions. Strong advocacy supporting continued, local government funding is needed to ensure that these monitoring investments continue.

Producer-led watershed groups
Increasing participation in farmer-led initiatives, such as Yahara Pride Farms and newer groups like Biological Farmer Friends, helps ensure that land managers are directly involved in shaping and applying nutrient-management and soil-health improvements — a key indirect-impact action in Renew the Blue.
Technical assistance and outreach
The Dane County Land & Water Resource Department and Yahara WINS partners continued to provide planning, technical, and cost-share support to landowners for practice adoption, representing the critical work that underpins on-the-ground gains.
Broader integration of sustainable land practices
Programs that integrate water quality with land health, like regenerative agriculture practices, continued to expand in 2025. These include cost-share supported cover cropping, reduced tillage, and vegetative buffer installation, helping to reduce phosphorus runoff while improving soil organic matter, infiltration, and carbon sequestration.
City of Madison rain gardens
Since the early 2000s, and at last count, approximately 773 rain gardens have been installed through cost-share programs and community partnerships. A typical residential rain garden can infiltrate thousands of gallons annually. Collectively, these installations are estimated to infiltrate millions of gallons of stormwater per year.

Dane County stormwater retrofits
Dozens of regional stormwater ponds and bioretention basins have been installed or upgraded across urbanizing sub-watersheds. Urban stormwater retrofits can remove 40–80% of total phosphorus from treated runoff, depending on design.
Green roofs
Madison alone now has more than 20 green roofs, including as part of municipal, university, and private developments. Green roofs can reduce annual runoff volume by 50–60% and significantly reduce peak flow during intense rainfall events. They provide important infiltration in dense urban areas where ground space is limited.

Conservation lands
Dane County Parks manages more than 12,000 acres of parkland and natural resource areas. The watershed includes thousands of acres of protected wetlands, prairies, and woodlands that function as natural infiltration zones. Land conservation programs have permanently protected tens of thousands of acres countywide, reducing development pressure in sensitive recharge areas.
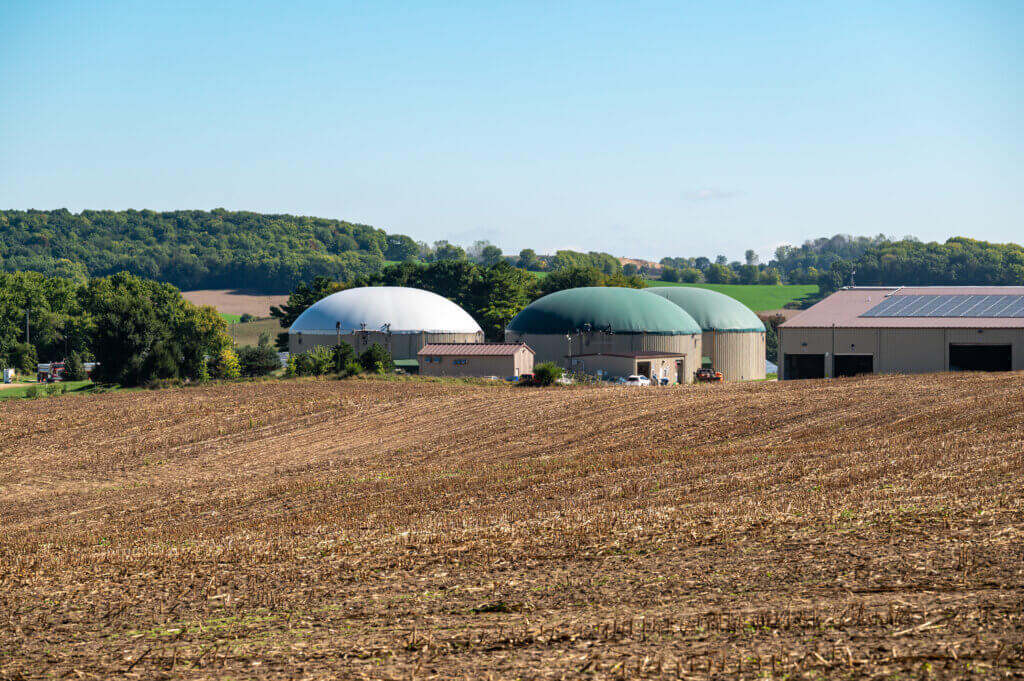
Agricultural manure management
The Yahara watershed produces more phosphorus in manure than crops remove annually, creating a structural surplus. Advanced manure treatment (e.g., digesters and nutrient separation systems) can be used to help export phosphorus out of saturated regions. Dane County has completed an initial feasibility study and is reviewing the possibility of eventually adding a third treatment facility to the northern part of the watershed.
Urban leaf management
Fall leaf debris is one of the largest seasonal urban phosphorus sources. Studies show that timely leaf collection can reduce phosphorus in urban runoff by 50% or more during autumn storm events. Consequently, most communities are either maintaining or expanding their leaf-collection and street-sweeping programs.
To learn more about watershed-friendly actions, visit “Renew the Blue” and “Top 10 Ways to Help the Lakes at Home.”

About the State of the Lakes
The annual State of the Lakes is released each year as part of the Teejop Regional Guide (formerly known as the Greater Madison Lake Guide). In it, we report out to the community on the state of water quality in our lakes. The report also looks at our collective progress toward our phosphorus reduction goal.
The report highlights information from many partners to share the most up-to-date science on water quality in our lakes. We feature local projects, including work in urban areas to protect stormwater quality and progress on farms to keep nutrients on the fields and out of our lakes.
In addition, we provide more information about Clean Lakes Alliance and our efforts to engage the community and advocate for the lakes. This report serves as a reference and a resource, highlighting community progress toward cleaner, healthier lakes for all.
Learn more about our lakes
Learn more about lakes Mendota, Monona, Wingra, Waubesa, and Kegonsa.
Past reports:
- 2024 State of the Lakes
- 2023 State of the Lakes
- 2022 State of the Lakes
- 2021 State of the Lakes
- 2020 State of the Lakes Report
- 2019 State of the Lakes Report
- 2018 State of the Lakes Annual Report
- 2018 Progress and Challenges video – shown at the 2019 Community Breakfast “Join the Wave”
- 2017 State of the Lakes Annual Report
- 2016 State of the Lakes Annual Report
- 2015 State of the Lakes Annual Report
- 2014 State of the Lakes Annual Report
- 2013 State of the Lakes Annual Report
- 2012 Annual Report / 2012 State of the Lakes Report
- 2011 State of the Lakes Report