LakeForecast water quality monitoring in 2023
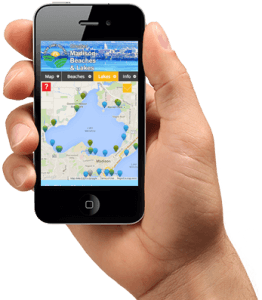
Clean Lakes Alliance’s LakeForecast water quality monitoring program completed its 11th season in 2023. This program is entirely volunteer implemented, with 90 trained monitors assessing water quality conditions from nearshore and offshore locations across all five Yahara lakes (Mendota, Monona, Wingra, Waubesa, and Kegonsa). From Memorial Day through Labor Day, volunteers recorded water clarity, air and water temperature, waterfowl presence, extent of floating plant debris, and the severity of green algae and cyanobacteria at public beaches, lakeside parks, and private piers. Submitted data can be seen in real-time on lakeforecast.org or our free app allowing the general public to stay up to date on current lake conditions.
Data collected from our monitors is used to advocate for implementing watershed improvement projects, raise additional dollars to protect our waters, and prepare our annual State of the Lakes Report outlining conditions, trends, and water quality drivers affecting the five Yahara lakes.
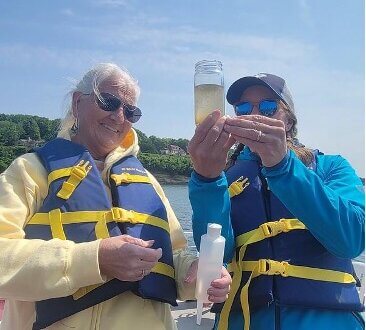
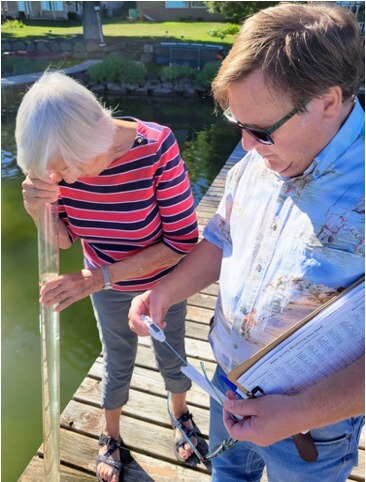
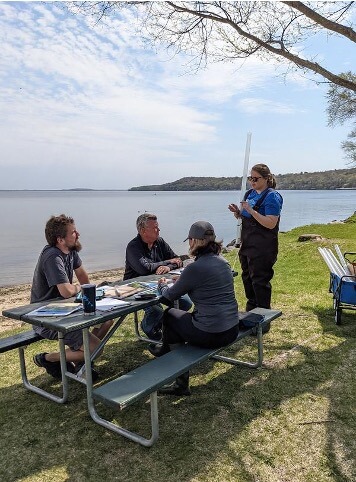
LakeForecast would not be possible without our dedicated volunteers giving their time and passion to improving Greater Madison’s lakes. Their condition reports highlight the challenges and opportunities when it comes to our lakeside spaces, support important public health initiatives at our public beaches, and improve our understanding of evolving lake dynamics. Thank you, volunteers!
2023 program highlights
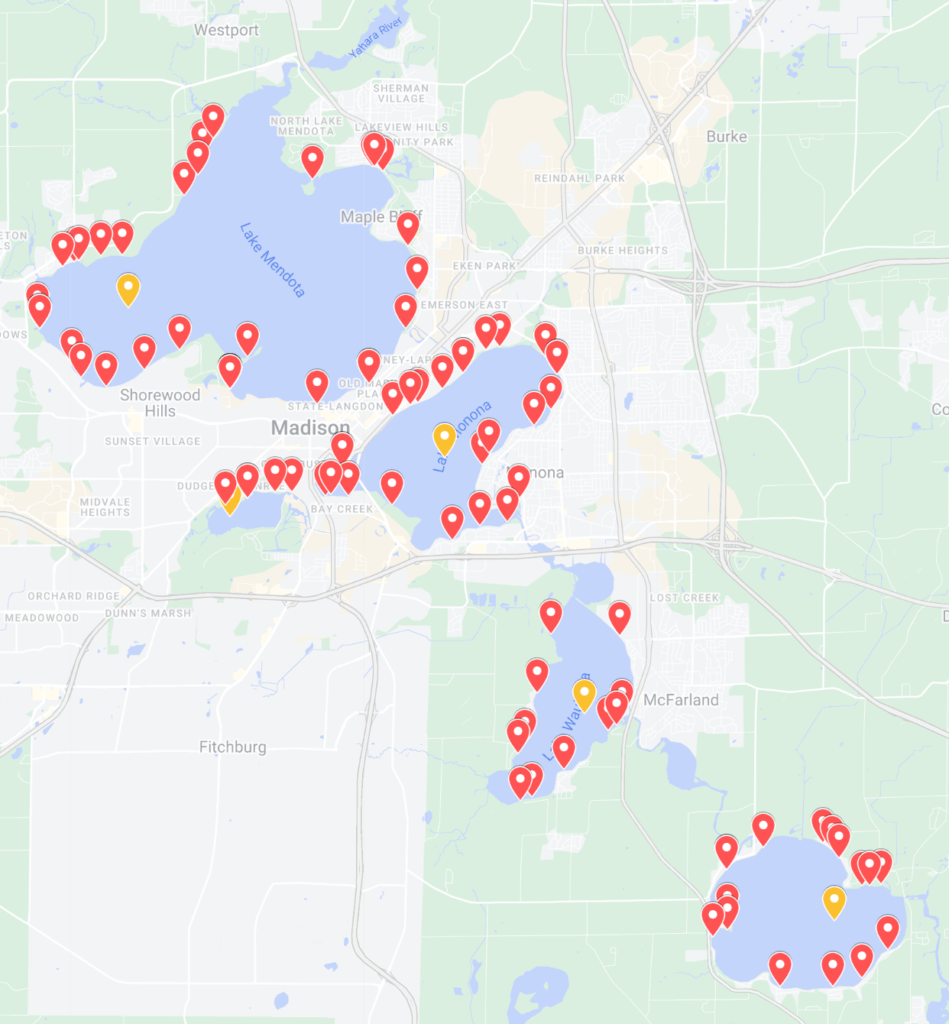
- 87 nearshore and 5 offshore monitoring stations covering all five Yahara lakes (Figure 1)
- All 25 public beaches monitored at least twice a week
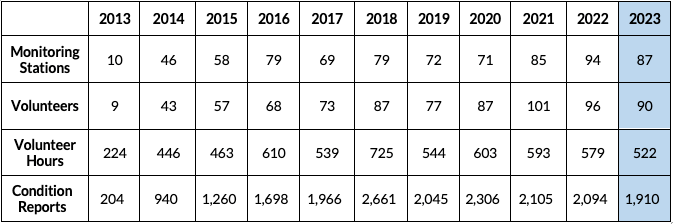
- 90 volunteers contributing 1,910 LakeForecast condition reports
- Algal toxin testing at 10 sites in partnership with UW-Madison Civil & Environmental Engineering
- Partnership with Lake Waubesa Conservation Association to add 4 new monitoring sites
- Partnership with Friends of Lake Kegonsa (FOLKS) to add 3 new monitoring sites
- Volunteer celebration and trivia night at Christy’s Landing
Analysis summary
During the 2023 monitoring season, low spring and summer rainfall volume and intensity coincided with good water clarity, resulting in higher green algae but fewer cyanobacteria blooms across the five lakes.
This aligns with our understanding of how rainfall drives phosphorus delivery to the lakes, fueling algal blooms. However, precipitation patterns alone are insufficient to explain the conditions seen throughout the spring and summer. Long-term climate trends, the timing of larger rain events, impacts of invasive species, the effect of watershed conservation practices, and spatial variability of monitoring sites make it difficult to identify whole-lake water quality patterns. Watershed improvement projects aimed at reducing phosphorus loading into the lakes often have variable lag times before positive lake responses become noticeable. Clean Lakes Alliance remains dedicated to improving the water quality of the Yahara chain of lakes through partnership building, advocacy efforts, project implementation, and fostering stewardship throughout the watershed.
Additional readings
Please see Fundamental Concepts on Water Quality of the Yahara Chain of Lakes (Mendota, Monona, Wingra, Waubesa, and Kegonsa) for an excellent summary of our current understanding of lake dynamics. These concepts and understandings are also presented in RENEW THE BLUE: A Community Guide for Cleaner Lakes & Beaches in the Yahara Watershed (2022).
Water quality drivers
Rainfall
Based on weather gauge data from the Dane County Regional Airport, rainfall totals for 2023 (shown in Fig. 2) reflected a very dry start to the summer season. May and June’s collective rainfall totaled only 2.01 inches, compared to the normal 9.38 inches. July’s 6.21 inches of rain surpassed the monthly normal (4.51 inches), bringing much-needed relief and increased flow through the chain. However, drought conditions remained throughout the summer with August reporting lower-than-normal rainfall (2.42 inches), exasperating already low lake levels.
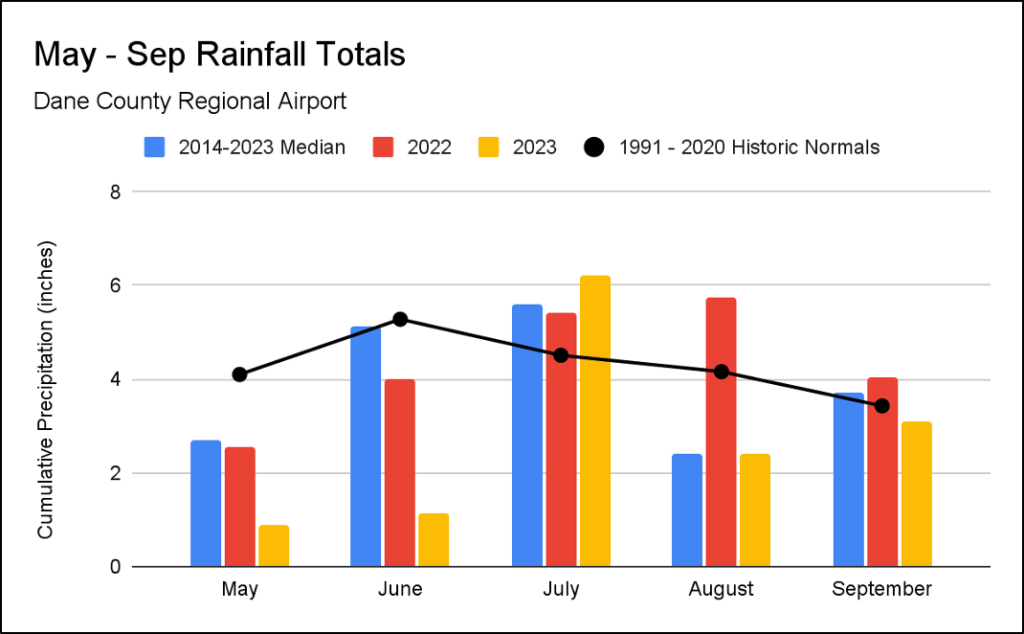
Additionally, May and June each experienced only one day of rainfall greater than 0.5 inches. Large “gully washing” rain events were minimal this spring and summer, contributing to less early-season runoff. The second half of the summer remained noticeably dry with July and August collectively experiencing only 3 days of rainfall greater than 0.5 inches, with the most notable being August 14th when 2.08 inches of rain was recorded.
Drought of 2023
This year’s continued drought conditions speak to the impacts that runoff has on phosphorus loading and water clarity response. Less stormwater moving across our landscape means less opportunity for polluted runoff to wash into our lakes. It is well documented that early-season rainfall (Jan.-Mar.) typically delivers the most phosphorus runoff to the lakes. As a result, this year’s low rainfall totals during that early-season time frame may have helped moderate total phosphorus contributions for the year.
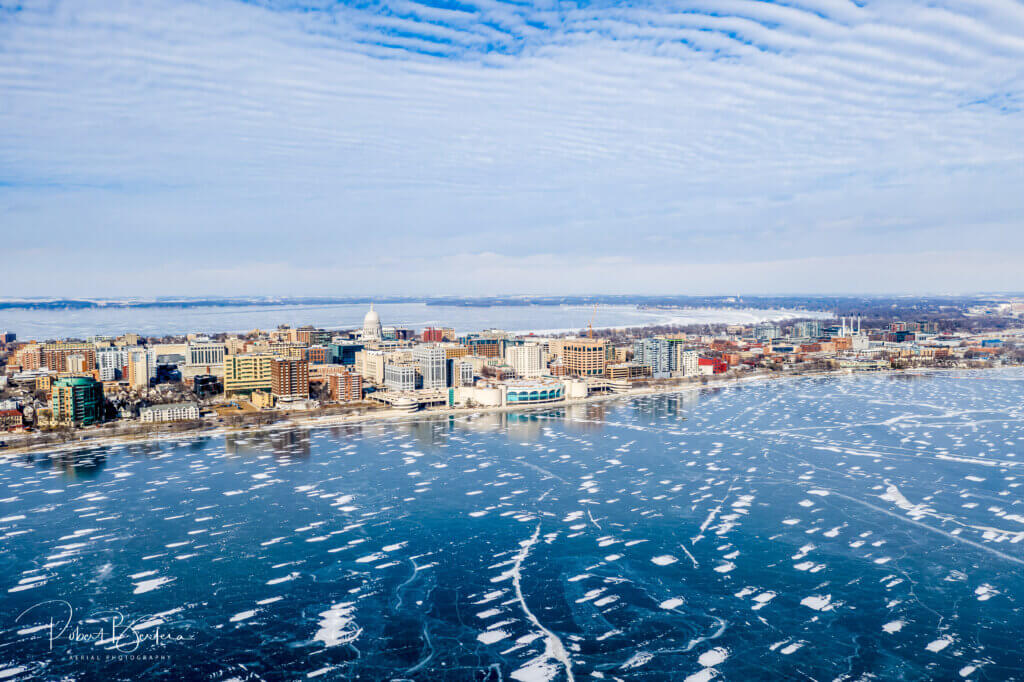
Lake ice
Winter temperatures were close to normal leading into the 2023 summer monitoring season. Lake Mendota remained frozen for 98 days, or 13 days longer than in 2022. This is on par with the median duration of ice cover on Lake Mendota (102 days) as measured over the last 168 seasons.
A shorter winter leads to warmer water temperatures earlier in the year, effectively creating a longer growing season for algae and aquatic plant life. Warmer winters can also lead to greater runoff and phosphorus delivery when wet precipitation falls on frozen soils and cannot soak into the ground. Rather than infiltrate, rainfall can more easily generate runoff that carries manure and other contaminants toward receiving water bodies. It is estimated that, on average, nearly half of total phosphorus loading through Lake Mendota’s monitored stream tributaries occurs from January to March, making late winter and early spring one of our most vulnerable times for negative water quality impacts.
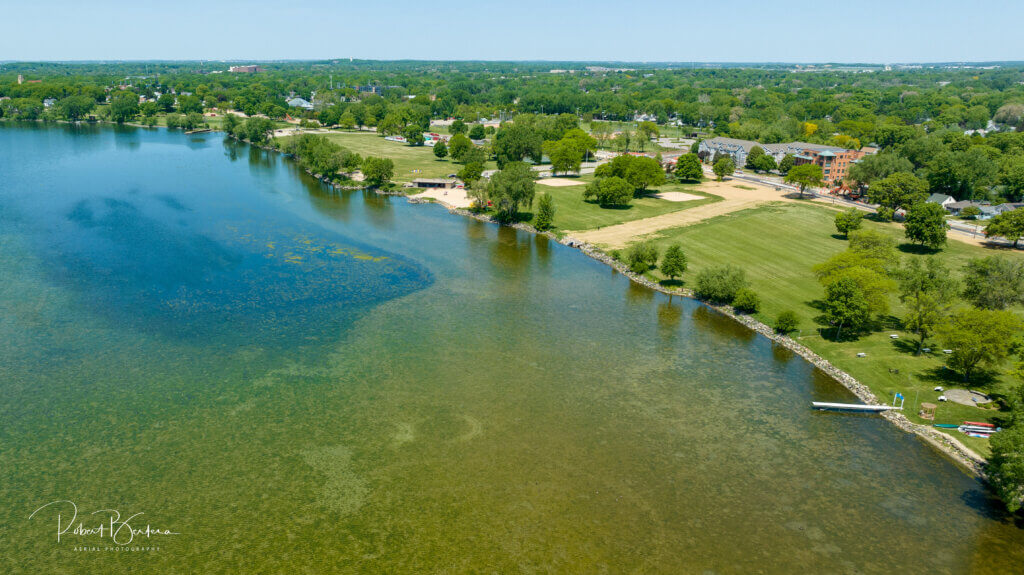
Water clarity
Below-normal rainfall in 2023 meant less runoff washing fertilizers, eroded soil, cow manure, and other sources of phosphorus into our lakes, resulting in comparatively higher clarity conditions. Limited rainfall likely contributed to fewer cyanobacteria blooms than we typically experience aiding high clarity readings.
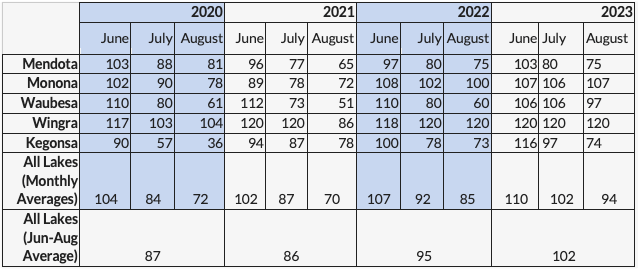
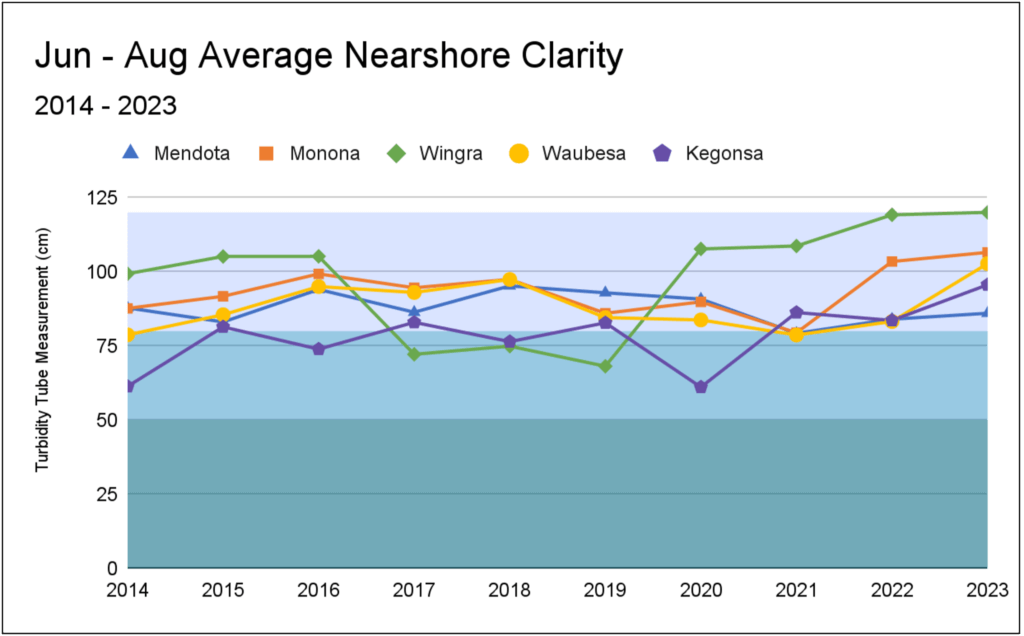
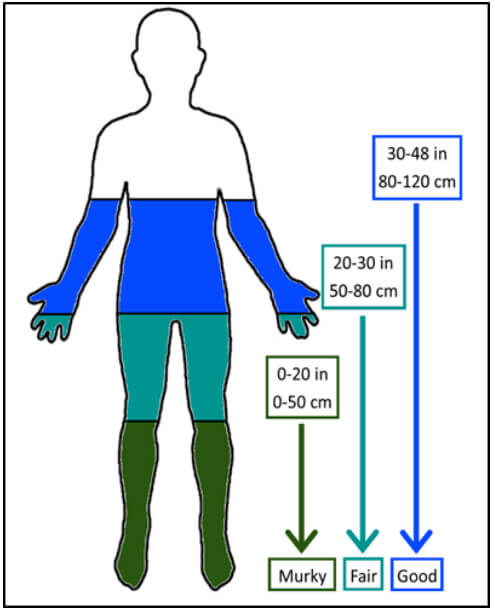
Table 2 below shows average water clarity recorded on each lake from June 1st – August 31st. Average nearshore clarity for 2023 was up for all lakes compared to last year’s averages.All lakes except for Mendota reported the highest clarity readings since LakeForecast monitoring started in 2014 (Figure 3). All five lakes fell within the “good” water clarity designation represented in Figure 4.
Cyanobacteria blooms and microcystin testing
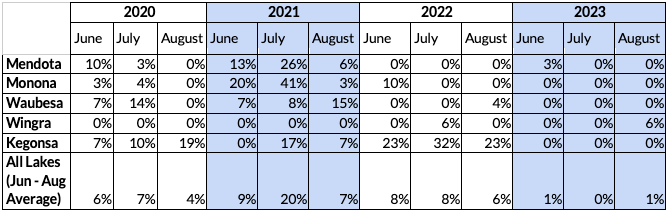
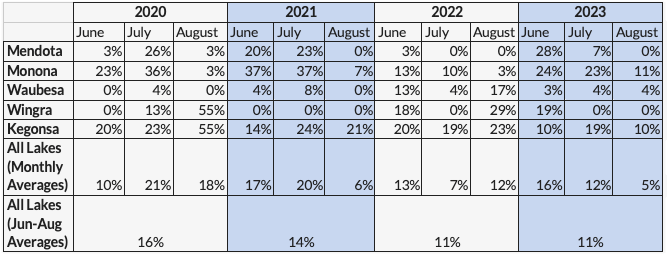
In reviewing this season’s bloom frequency, the same analytical method first adopted in 2018 was used. This approach counts the number of days on each lake with at least one report of a strong cyanobacteria bloom observed within the monitoring sites. By dividing the number of ‘cyanobacteria bloom days’ by the total number of sampling days for each lake, a percentage is generated representing how often the monitors observed at least one major bloom (Table 3). For example, Lake Kegonsa volunteers reported strong evidence of cyanobacteria on 16% of all monitored days in July 2023. This method lessens overreporting in situations when different monitors report the same cyanobacteria bloom.
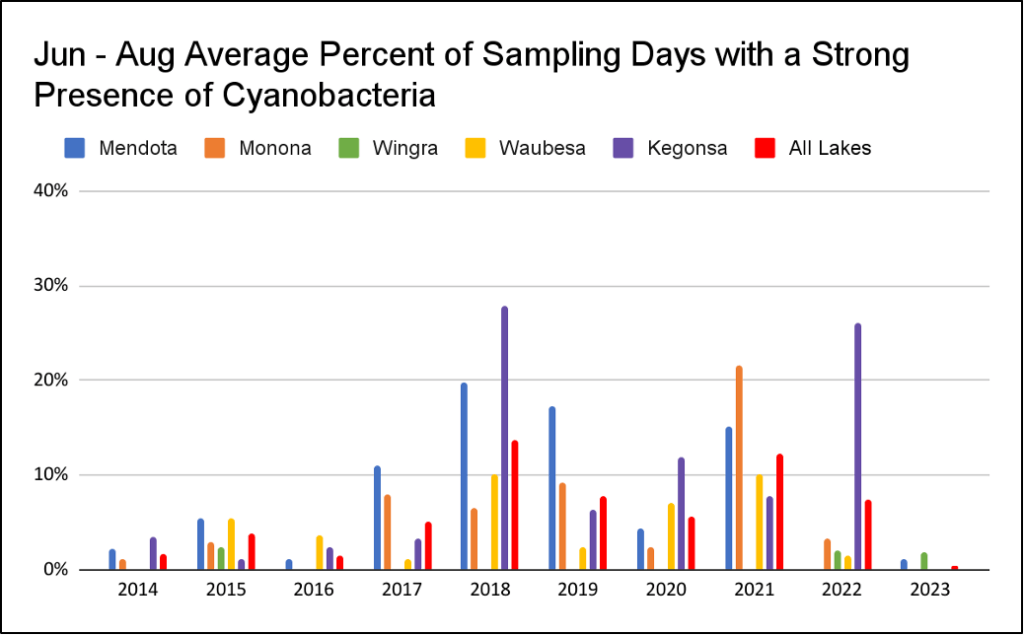
Overall, monitors reported low cyanobacteria blooms during the 2023 sampling period, with most of our significant blooms occurring at the end of May and early June (Figure 5). Monitors on Monona, Waubesa, and Kegonsa did not report a single significant bloom. This is welcomed news after last year’s record-high bloom count on Kegonsa. Lake Wingra experienced similar bloom counts to last year, and Lake Mendota had a handful of significant blooms reported in 2023 after not experiencing any in 2022.
Cyanobacteria forecasts
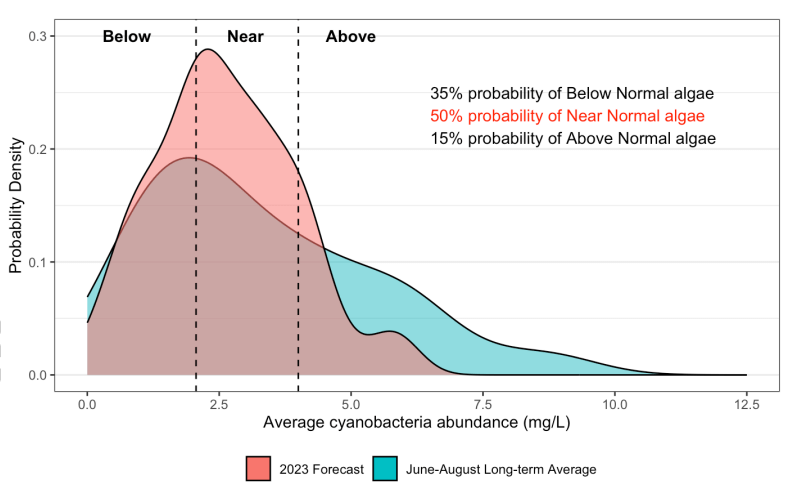
These results are consistent with an earlier analysis performed by Dr. Paul Block’s lab at UW-Madison. Dr. Block’s team creates cyanobacteria forecasts for Lake Mendota using geospatial satellite imagery, global weather and ocean circulation patterns, and data collected from our monitors to predict the likelihood of cyanobacteria blooms in our lakes (Figure 6). In early June, Dr. Block’s team estimated that “despite the early bloom and warm temperatures, our prediction for 2023 reflects a high likelihood of near normal cyanobacteria biomass and a normal number of beach days closed due to elevated cyanobacteria. The models only predict a 15% chance of above-average conditions, largely due to the developing El Niño in the Pacific Ocean” predicting average cyanobacteria biomass for the season.
Testing for microcystins
A select group of LakeForecast monitors provided supplemental microcystin testing for Dr. Block’s lab at ten locations in 2023. Microcystins are a common class of toxins that can be produced by cyanobacteria, making them unsafe and potentially lethal to people, pets, and wildlife. As a reminder, cyanobacteria (also known as blue-green algae) is not an algae, but a photosynthesizing bacteria naturally occurring in our waters. Only certain strains of cyanobacteria can produce microcystins and species able to generate this toxin do not necessarily produce microcystins during each bloom. In addition, microcystin concentrations are not always correlated with the intensity of the bloom. Having a greater understanding of when cyanobacteria produce microcystins and at what concentration could aid public health officials in assessing toxicity risk.
Monitors reported when blooms were and were not present to randomize collections. Of the 92 samples collected in 2023 across Mendota, Monona, Wingra, and Kegonsa, only 21 tests were positive for the presence of microcystins. Of the tests with positive microcystin results, 10 samples had a microcystin concentration of 10 parts per billion (ppb) or higher. For reference, Public Health of Madison and Dane County close our beaches at 8 ppb or higher.
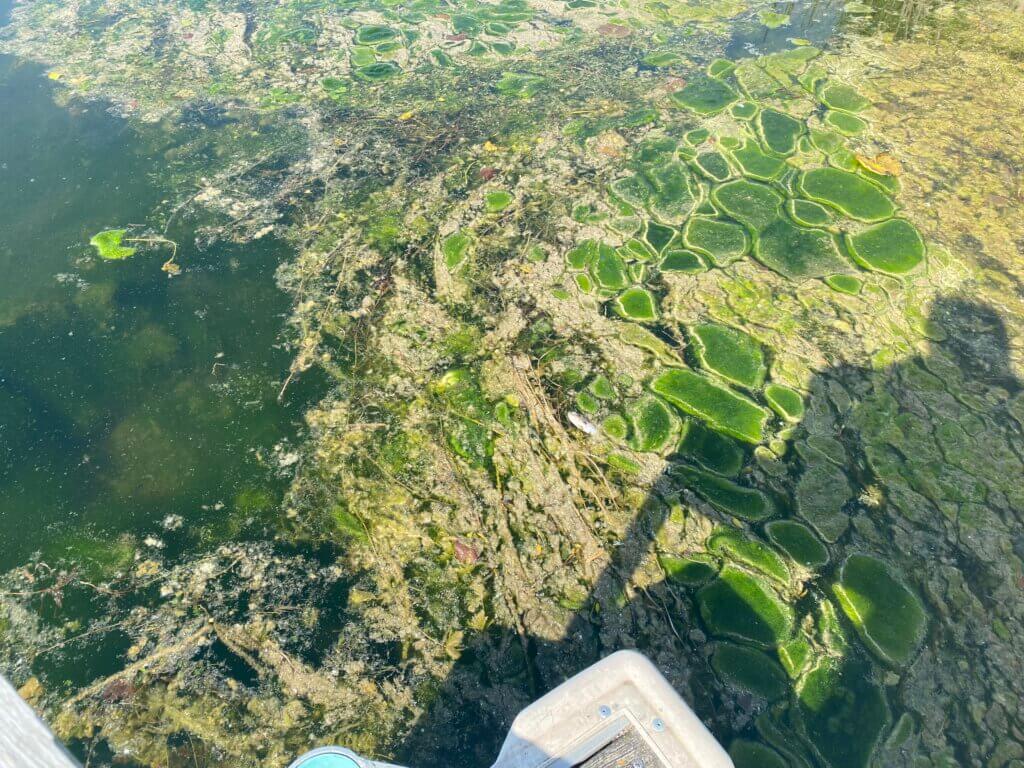
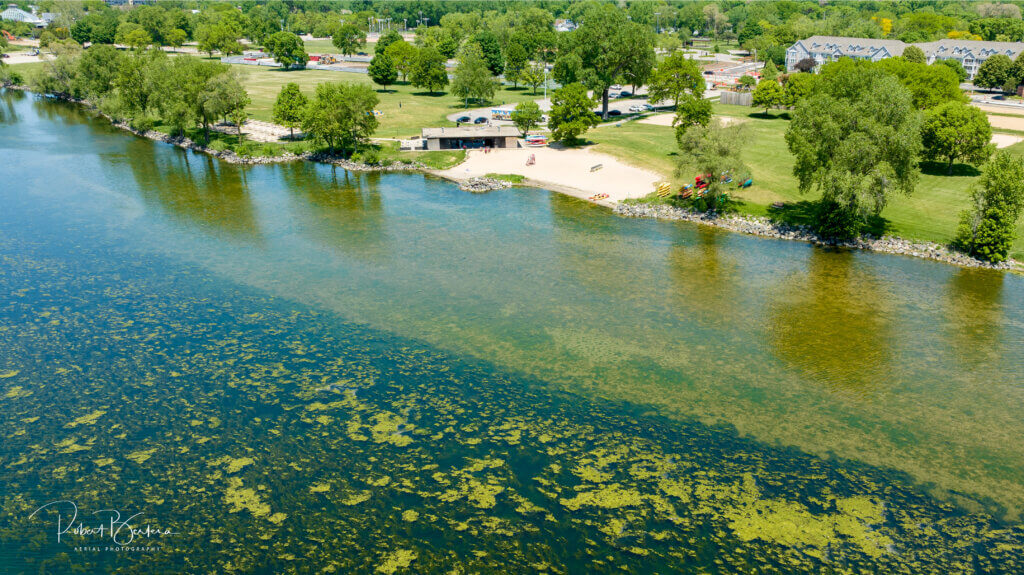
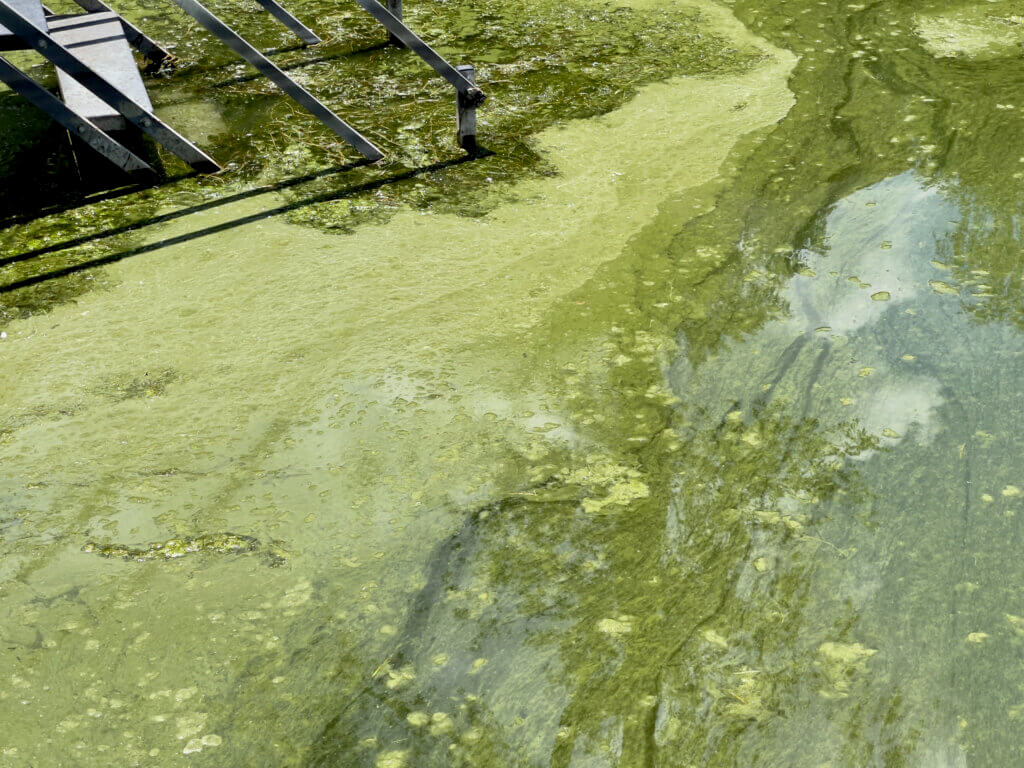
Green algae blooms
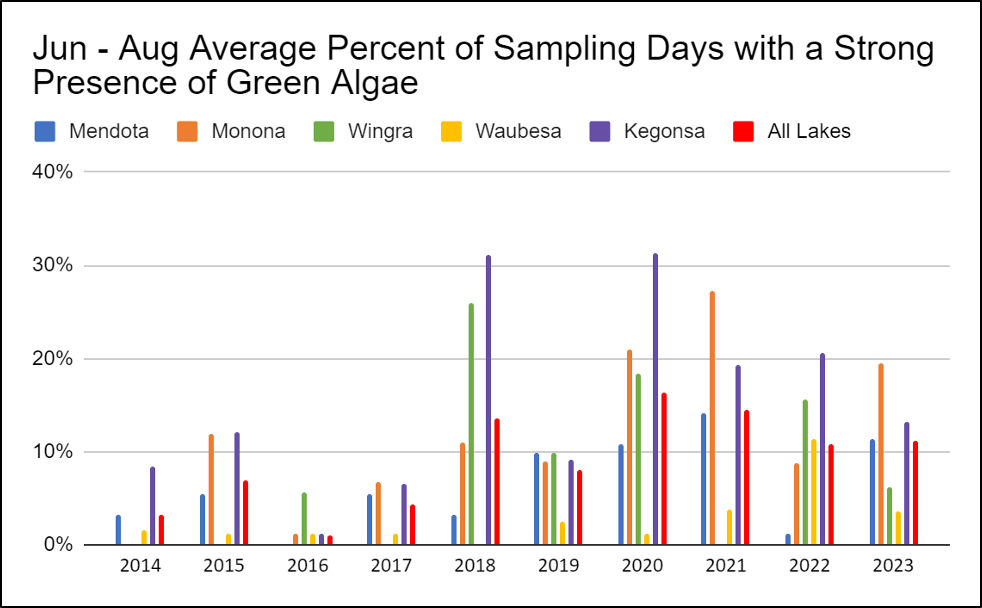
While comparatively fewer cyanobacteria blooms were reported, the same cannot be said for green algae blooms. We had numerous reports of green algae overtaking sampling sites at certain locations. However, the table below shows that 2023 was a typical year regarding historically reported green algae blooms (Table 4). Lakes Mendota and Monona experienced more significant blooms than last year, while Wingra, Waubesa, and Kegonsa received fewer reports of blooms compared to 2022 (Figure 7).
We utilized the same analytical method for green algae blooms as cyanobacteria blooms. This approach counts the number of days when one or more monitors reported “strong evidence” for a green algae bloom at their monitoring station. By dividing the number of ‘green algae bloom days’ by the total number of sampling days for each lake, a percentage is generated that better represents the number of blooms witnessed each year on a given lake (Table 4). This method lessens overreporting when different monitors might report the same algal bloom.
Increased algae with sunlight
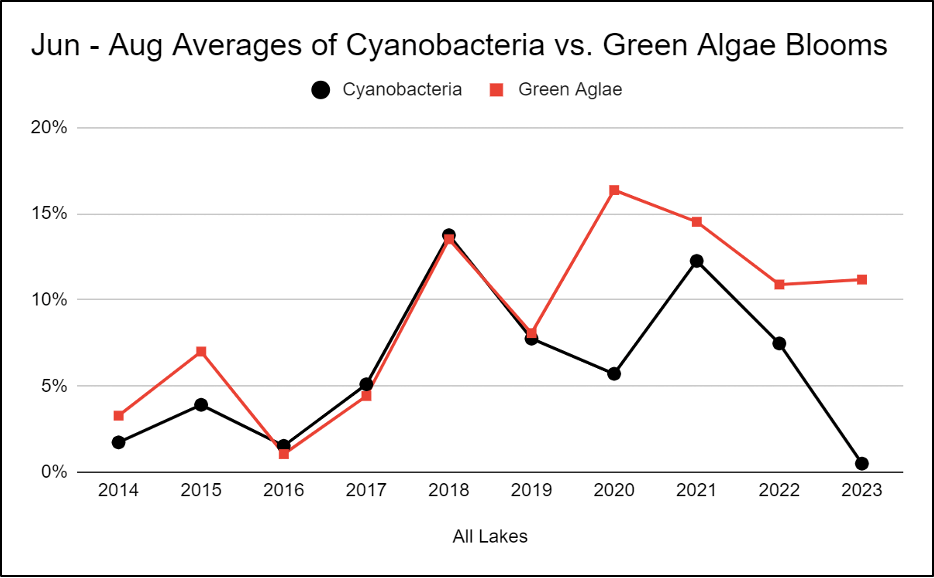
Increased green algae production is common in high-fertility lakes as clarity increases due to sunlight being able to penetrate deeper into the water column and wider across the lake bed. As shown in Figure 8, there has been a considerable difference in the type of blooms reported by monitors from year to year, with noticeably more green algae blooms than cyanobacteria starting in 2020. While it’s perhaps welcomed news to have fewer cyanobacteria blooms across our lakes, green algae blooms are also a symptom of excess phosphorus. At moderate levels, green algae and native aquatic plants play an important role in maintaining healthy lake ecosystems. It’s worth noting that green algae on its own is not harmful to human or animal health, but it can be an unwelcome nuisance when this floating organic debris overtakes beaches and piers.
For questions or comments regarding LakeForecast or the material provided, please contact Caitlin McAleavey, Watershed Engagement Manager (caitlin@cleanlakesalliance.org), and Paul Dearlove, Deputy Director and Chief Science Officer (paul@cleanlakesalliance.org).
Thank You, Monitors!
Clean Lakes Alliance wishes to recognize the following volunteer LakeForecast monitors for their many contributions to the success of this program:
Lake Mendota
- Rhonda Arries
- Lynn Ascione
- George Benton
- Mathew Chotlos
- Emily Conklin
- Bennett Davishoff
- Doris Dubielzig
- Jan Eddy
- Nancy Ellison
- Friends of UW Lakeshore Nature Reserve
- Robert Gilbert
- Bob Gross
- Mary Hillebrand
- Andy Ippolito
- Jerry Jendrisak
- Sydney Kerstein
- Arlene and Jeff Koziol
- Jackie Lanear
- Jay Larson
- Peggy Lee
- Allan Levin
- Linda Malkin
- Seth McGee
- Carol Michalski
- MJ and Tom Morgan
- Stephanie Ogborne
- Raymond Rajala
- Cole Seckel
- Kim Sprecher
- Jacob Stampen
- Mattie Urrutia
- Will Vuyk
- Angela Webster
- Ian Wegger
Monona
- Allen Arntsen
- Doug Bach
- Jill Ball
- Bob Bertera
- Carolyn Betz
- Brittingham Boats
- Claire Finucane
- Amie Francisco
- Rachel Groman
- Joanne Kaminsky
- Renee Long
- Mel McCartney
- Elaine Meier
- Joy Newmann
- Austin Novak
- Michael Oleniczak
- Reed Rodenkirch
- Zak Redding
- David Schroder
- Tom Smith
- Christine Stocke
- Jan Van Vleck
- Sam Warfel
- Amy Wencel
- Paul Zech
Lake Wingra - Regan Botsford
- Lisa Grueneberg
- Jess Hankey
- Cindy Koschmann
- Sally Lehner John Nicol
Lake Waubesa
- Kitty Brussock
- Cassy Cooley
- Troy Hibicki
- Mike Horn
- Marissa Hueffner
- Ginny Kominiak
- Woody Kneppreth
- Tam Knickmeier
- John McIntyre
- Mike Moran
- Tom Reuschlein
- Lori Wallman
- Kimberly Walsh
Lake Kegonsa - Sarah Balz
- Bill & Amanda Blank
- John Bottorff
- George Corrigan
- Connie Hagen
- Janice Kellogg
- Ken LePine
- Anne Meisner
- Terry Peterson
- Claudia and Greg Quam
- Gary Tapper
- Peg Stine and Carl Johnson
- Kim Van Brocklin
- Kim & Tom Walz
- Jim Wilcox