LakeForecast water quality monitoring in 2022
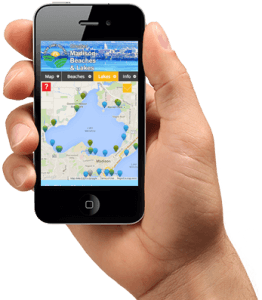
In 2022, our volunteers embarked on the 10th season of LakeForecast water quality monitoring. This work involved collecting nearshore condition reports at piers, beaches, parks, and access points around the five Yahara lakes. From May through September, volunteers measured water clarity, recorded air and water temperature, identified the presence of green algae and cyanobacteria, and noted additional visual observations. Reports are entered into the LakeForecast app where all data are updated in real time.
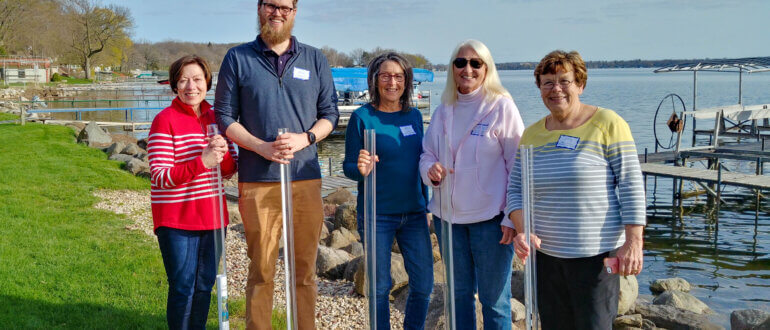
This initiative would not be possible if it were not for the dedication of all our volunteers. Volunteer efforts better inform the community about changing water quality conditions while improving our understanding of evolving lake dynamics. Their work also helps share important public health information with the greater community.
Program highlights
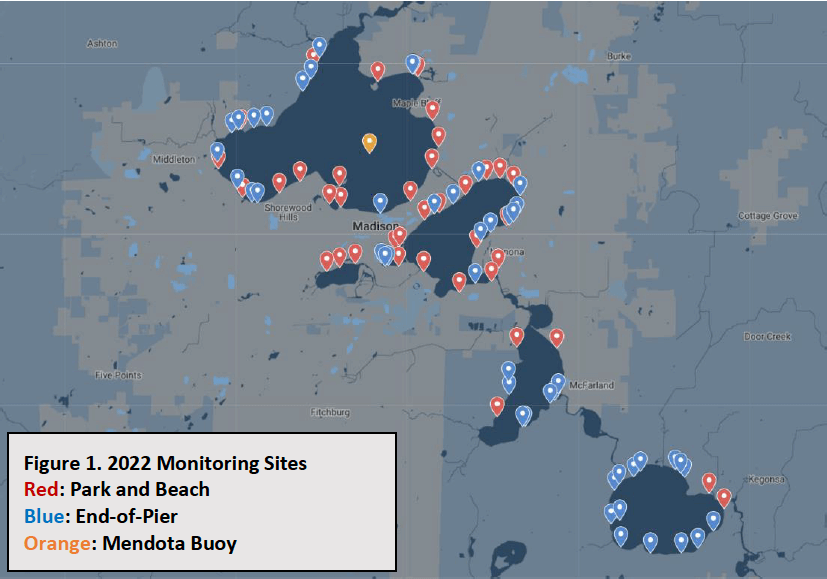
- 87 nearshore and 7 offshore monitoring stations covering all five Yahara lakes (Figure 1)
- All 25 public beaches monitored at least twice a week
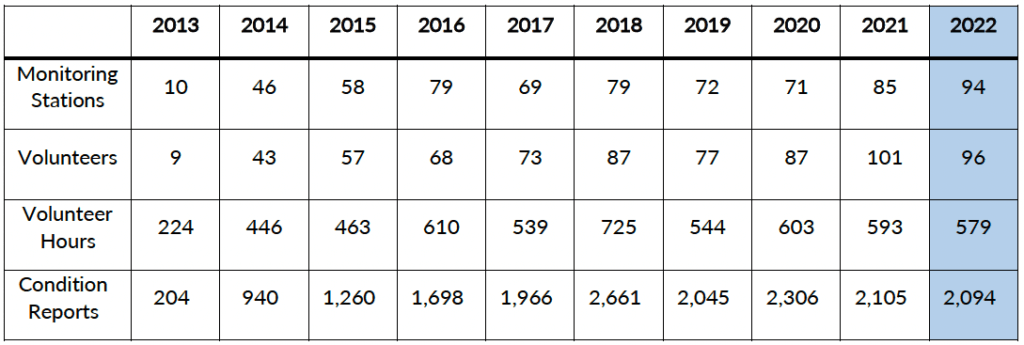
- 96 volunteers contributing 2,094 LakeForecast condition reports
- Algal toxin testing at 7 sites in partnership with UW-Engineering
- Partnership with BloomOptix to pilot rapid cyanobacteria detection using digital microscopes
- Partnership with Friends of Lake Kegonsa Society (FOLKS) to add 6 new monitoring sites
- Volunteer appreciation night at Christy’s Landing
Water quality drivers and observations
Rainfall
“If the amount of streamflow was the same every year, it is estimated that phosphorus inputs to Lake Mendota would have decreased by about 36% over the last 30 years. This indicates that land management practices are effective, but that wet weather and more runoff can more than offset the benefits of those practices.”
Yahara CLEAN Compact’s RENEW THE BLUE: A Community Guide for Cleaner Lakes & Beaches in the Yahara Watershed (2022)
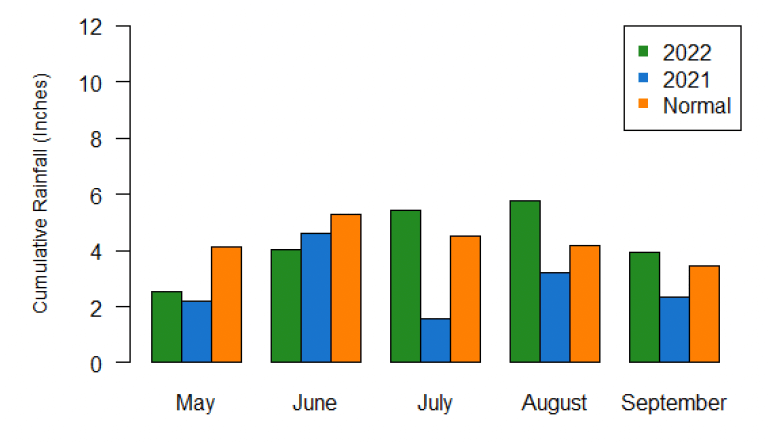
Based on weather gauge data from the Dane County Regional Airport, rainfall totals for 2022 (shown as green bars in Figure 2) revealed a dry start to the season followed by a return to above-normal conditions from July-September. May and June were particularly dry months with only 2.54 and 4.02 inches of rainfall, respectively. Additionally, May and June experienced only one day each of rainfall greater than 0.50 inches. The large “gully washing” rain events were minimal this spring, perhaps contributing to less early season runoff.
The second half of the summer was significantly wetter with July, August, and September seeing totals above Normal (5.42, 5.76, and 3.95 inches, respectively). It is well documented that early-season rainfall delivers the most phosphorus runoff to the lakes. Consequently, low May and June rainfall totals may have helped moderate total phosphorus contributions for the year.
Lake ice
The winter leading into the 2022 summer monitoring season was relatively warm, with Lake Mendota freezing for 85 days, only nine days longer than the previous year when it froze for 76 days. For reference, the median duration of ice cover on Mendota is 103 days as measured over the last 167 seasons.
A shorter winter leads to warmer temperatures earlier in the year, effectively creating a longer growing season for algae and aquatic plant life. Warmer winters can also lead to greater runoff and phosphorus delivery when wet precipitation falls across frozen soils. Rather than soak into the ground, rainfall can more easily generate runoff that carries manure and other contaminants toward receiving waterbodies.
Algal blooms
In documenting cyanobacteria blooms, we continued to use the same method first utilized in 2018. This approach tallies for each lake the number of days when one or more strong* cyanobacteria blooms are reported. By comparing the number of ‘algal days’ to the total number of unique sampling days for each lake, we can generate a percentage that better represents the number of blooms witnessed each year (Figure 3). For example, Lake Monona volunteers reported strong evidence of cyanobacteria on 15.2% of all monitored days in 2021. This method lessens over reporting in situations when different monitors report the same algal bloom.
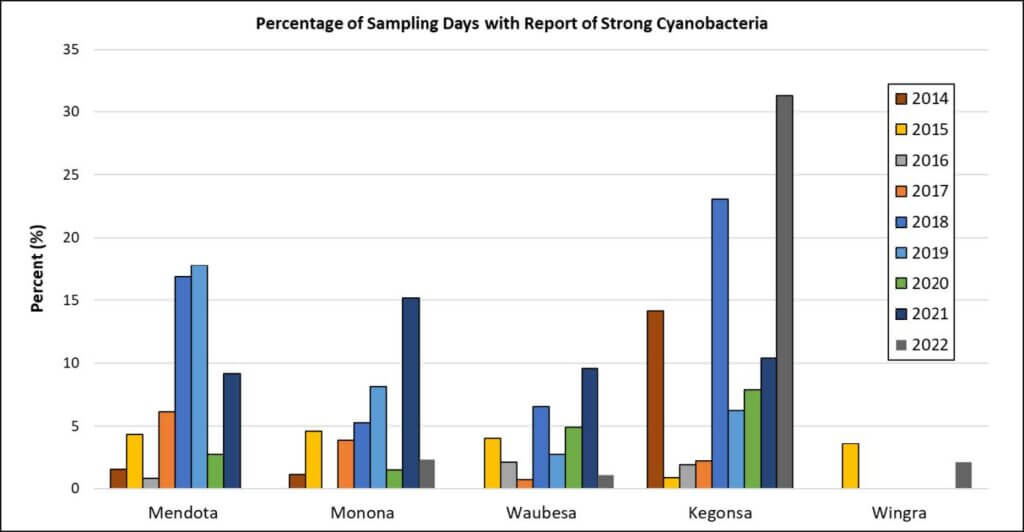
Compared to 2021, monitors documented less “strong evidence” of cyanobacteria blooms on all lakes except Kegonsa (Figure 3). Mendota, Monona, and Waubesa had some of the lowest reports of strong algal blooms on record. For the first time since LakeForecast nearshore monitoring began in 2014, Lake Mendota lasted the entire season without a single report of a strong cyanobacteria bloom. On the whole, the Yahara lakes chain had a positive summer in terms of cyanobacteria presence.
Kegonsa is an outlier in 2022
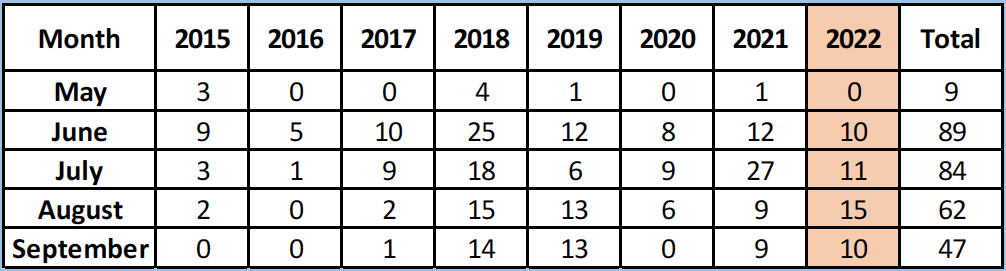
In stark contrast, Lake Kegonsa volunteers surpassed the all-time high and identified strong blooms on 31% of all sample days. Lake Wingra remained consistent with only one day of strong cyanobacteria reported in early July. The monthly breakdown in Table 2 shows a fairly consistent trend June-September. However, it’s important to note that the significant majority of the reports come from Lake Kegonsa.
Taking a closer look at Lake Kegonsa’s data, we can surmise one potential explanation for the notable increase in cyanobacteria reports. This year, Kegonsa added 6 new volunteers to their roster to improve the spatial coverage of monitoring efforts. These additional sites result in an overall increase in reporting frequency. In other words, there are more eyes on the lake to catch blooms when they are happening. One new site in particular is located in an area that is geographically more prone to wind driven algal accumulation. 53% of all strong reports of cyanobacteria on Lake Kegonsa came from a single location on the south side of Colladay Point. While there are likely many variables contributing to the increased algal bloom presence on Kegonsa, it’s important to consider the variations in sampling frequency.
Clarity
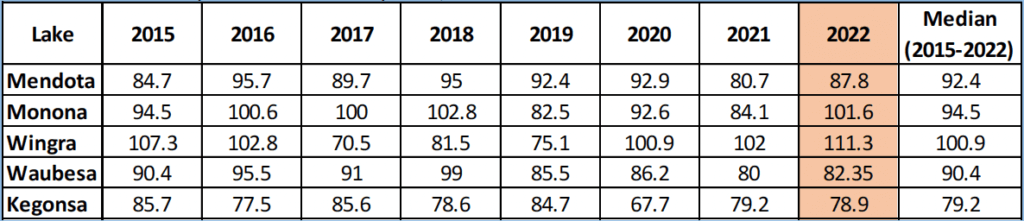
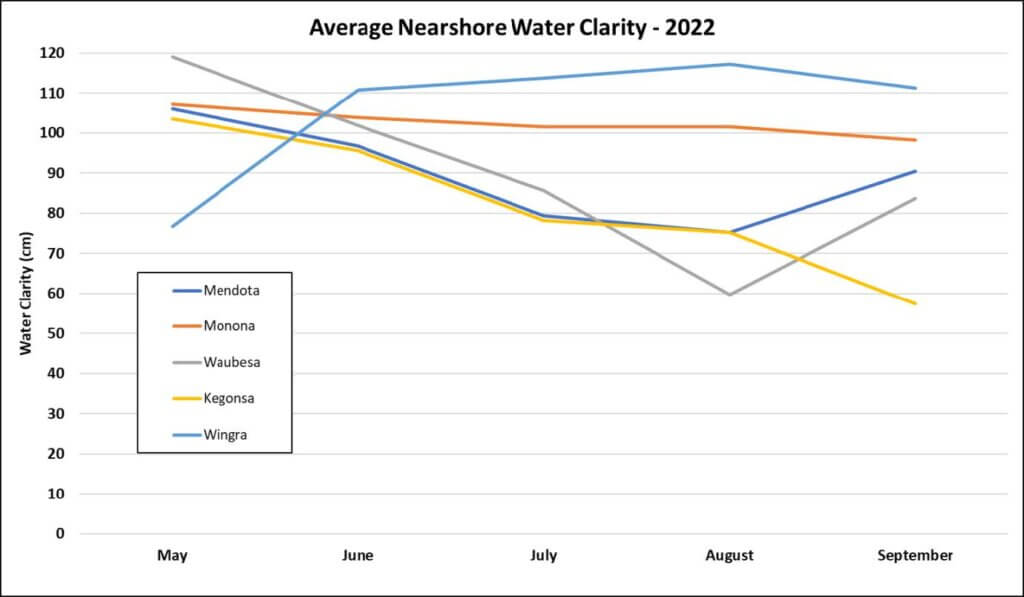
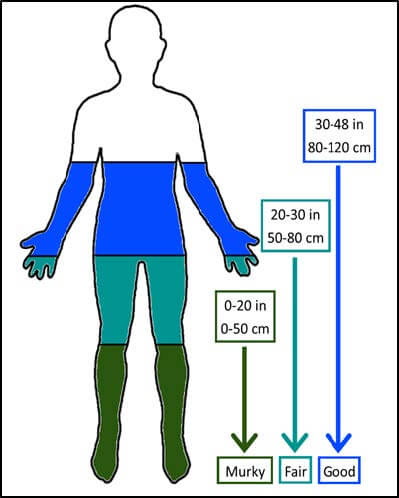
Table 3 shows average clarity calculated from May 1 to September 30, 2022, relative to the median clarity for all years. Compared to 2021, all lakes except Kegonsa showed a marked improvement in average water clarity and fell within the ‘good’ water clarity designation as represented in Figure 5. Lakes Monona and Wingra reported particularly high average water clarity that was greater than their respective long-term medians. Lake Kegonsa, despite the challenges of increased cyanobacteria sightings, reported similar average clarity to last year and only slightly less that the 2015-2022 median.
As depicted in Figure 4 below, average clarity for most lakes generally decreases throughout the summer with a peak decline in August. Lakes Monona and Wingra deviated from this trend by exhibiting relatively high clarity readings throughout the season. Like previous years, Kegonsa’s shallower depth combined with its low-elevation landscape position within the watershed likely contributed to its lower clarity readings.
2022 compared to long-term trends
During the 2022 monitoring season, low spring rainfall volume and intensity coincided with good water clarity and few strong cyanobacteria blooms on all lakes except for Lake Kegonsa. This aligns with our understanding of how rainfall drives phosphorus delivery to the lakes, fueling algal blooms. However, it’s important to remember precipitation patterns alone are insufficient to explain condition reports seen throughout the spring and summer. Long-term climate trends, the timing of larger rain events, impacts of invasive species, the effect of watershed conservation practices, and random spatial variability make it difficult to identify whole-lake patterns of water quality. There can also be long lag times between watershed actions that reduce phosphorus and lake response.
Data collected by LakeForecast volunteers offer a valuable tool to help us better understand ever-changing lake conditions. Real-time reports allow the public to track conditions on each lake as they vary across time and space. They also provide an early warning system as potentially harmful cyanobacterial blooms develop and dissipate.
Additional resources
Please see Fundamental Concepts on Water Quality of the Yahara Chain of Lakes (Mendota, Monona, Wingra, Waubesa, and Kegonsa) for an excellent summary of our current understanding of lake dynamics. These concepts and understandings are also presented in RENEW THE BLUE: A Community Guide for Cleaner Lakes & Beaches in the Yahara Watershed (2022).
Thank you!
Clean Lakes Alliance wishes to recognize the following volunteer LakeForecast monitors for their many contributions to the success of this program:
Lake Kegonsa
- Sarah Balz
- Bill & Amanda Blank
- John Bottorff
- Jim & Joan Cordray
- George Corrigan
- Connie Hagen
- Janice Kellogg
- Ken LePine
- Terry Peterson
- Greg Quam
- Kim Van Brocklin
- Dick Wallace
- Kim & Tom Walz
- Jim Wilcox
Lake Mendota
- Rhonda Arries
- Lynn Ascione
- George Benton
- Mathew Chotlos
- Doris Dubielzig
- Carson Eccles
- Nancy Ellison
- Emma Erickson
- Robert Gilbert
- Bob Gross
- Paul Hendrickson
- Mary Hillebrand
- Andy Ippolito
- Jerry Jendrisak
- Arlene Koziol
- Jackie Lanear
- Jay Larson
- Kim & Matt Lechmaier
- Peggy Lee
- Allan Levin
- Linda Malkin
- Seth McGee
- Carol Michalski
- MJ and Tom Morgan
- Catherine Nguyen
- Stephanie Ogborne
- Raymond Rajala
- Diana Tapia Ramon
- Cole Seckel
- Kim Sprecher
- Jacob Stampen
- Jeff Steele
- Jane Sullivan
- John Tye
- Will Vukk
- Brooke Waterman
- Ian Wegger
Lake Monona
- Allen Arntsen
- Doug Bach
- Jill Ball
- Bob Bertera
- Carolyn Betz
- Brittingham Boats
- Kari Brock
- Mary Crenny
- Sarah Fix
- Kaelin Fontaine
- Amie Francisco
- Steve Gordon
- Rachel Groman
- Chris and Jennifer Henderson
- Lindsey Klicko
- Mel McCartney
- Elaine Meier
- Cheryl Namyst
- Joy Newmann
- Michael Oleniczak
- Zach Redding
- David Schroder
- Tom Smith
- Jan Van Vleck
- Ken Walz
- Sam Warfel
- Amy Wencel
- Gwen Eudey
- Luke Wynn
- Madison Wynn
Lake Waubesa
- Kitty Brussock
- Cassy Cooley
- Mike Horn
- Mark Jung
- Woody Kneppreth
- Terri Lefebvre & Joe Campshure
- Robert Montgomery
- Kimberly Rios
- Mike Schmidt
- Lori Wallman (Beierle)
Lake Wingra
- Regan Botsford
- Lisa Grueneberg
- Cindy Koschmann
- Sally Lehner
- John Nicol