2018 takeaways
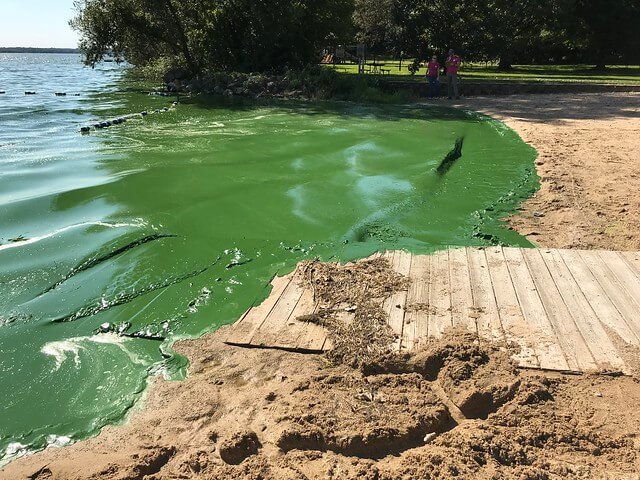
- Cyanobacteria (blue-green algae) blooms appeared in our lakes at an alarming scale, highlighting continued challenges with water quality.
- 72% of beach closures from Memorial Day to August 20th were due to cyanobacteria blooms
- June continues to be the biggest month for cyanobacteria blooms for the fourth year
- Heavy rain in the Greater Madison area sent more harmful runoff into our lakes. It also highlighted the need for green infrastructure and increased infiltration.
- All beaches were closed an additional 221 beach days after August 20th flooding
- The amount of developed area in the Yahara Watershed has nearly doubled since 1970 (41,000 to 75,000 acres) according to Dane County
- January and February rain contributed heavy loads of phosphorus to the lakes
- Close to twice as many one inch or greater rain events occurred compared to the average year
- More than 16 inches of precipitation above normal
Full 2018 State of the Lakes Annual Report
The Yahara River Watershed
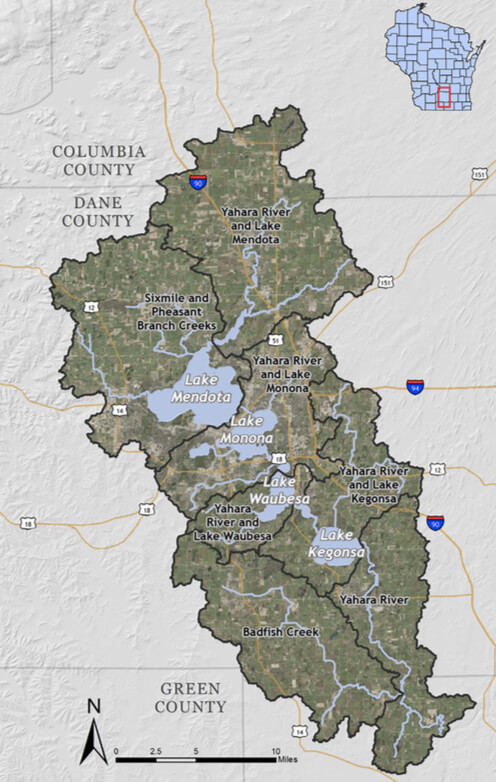
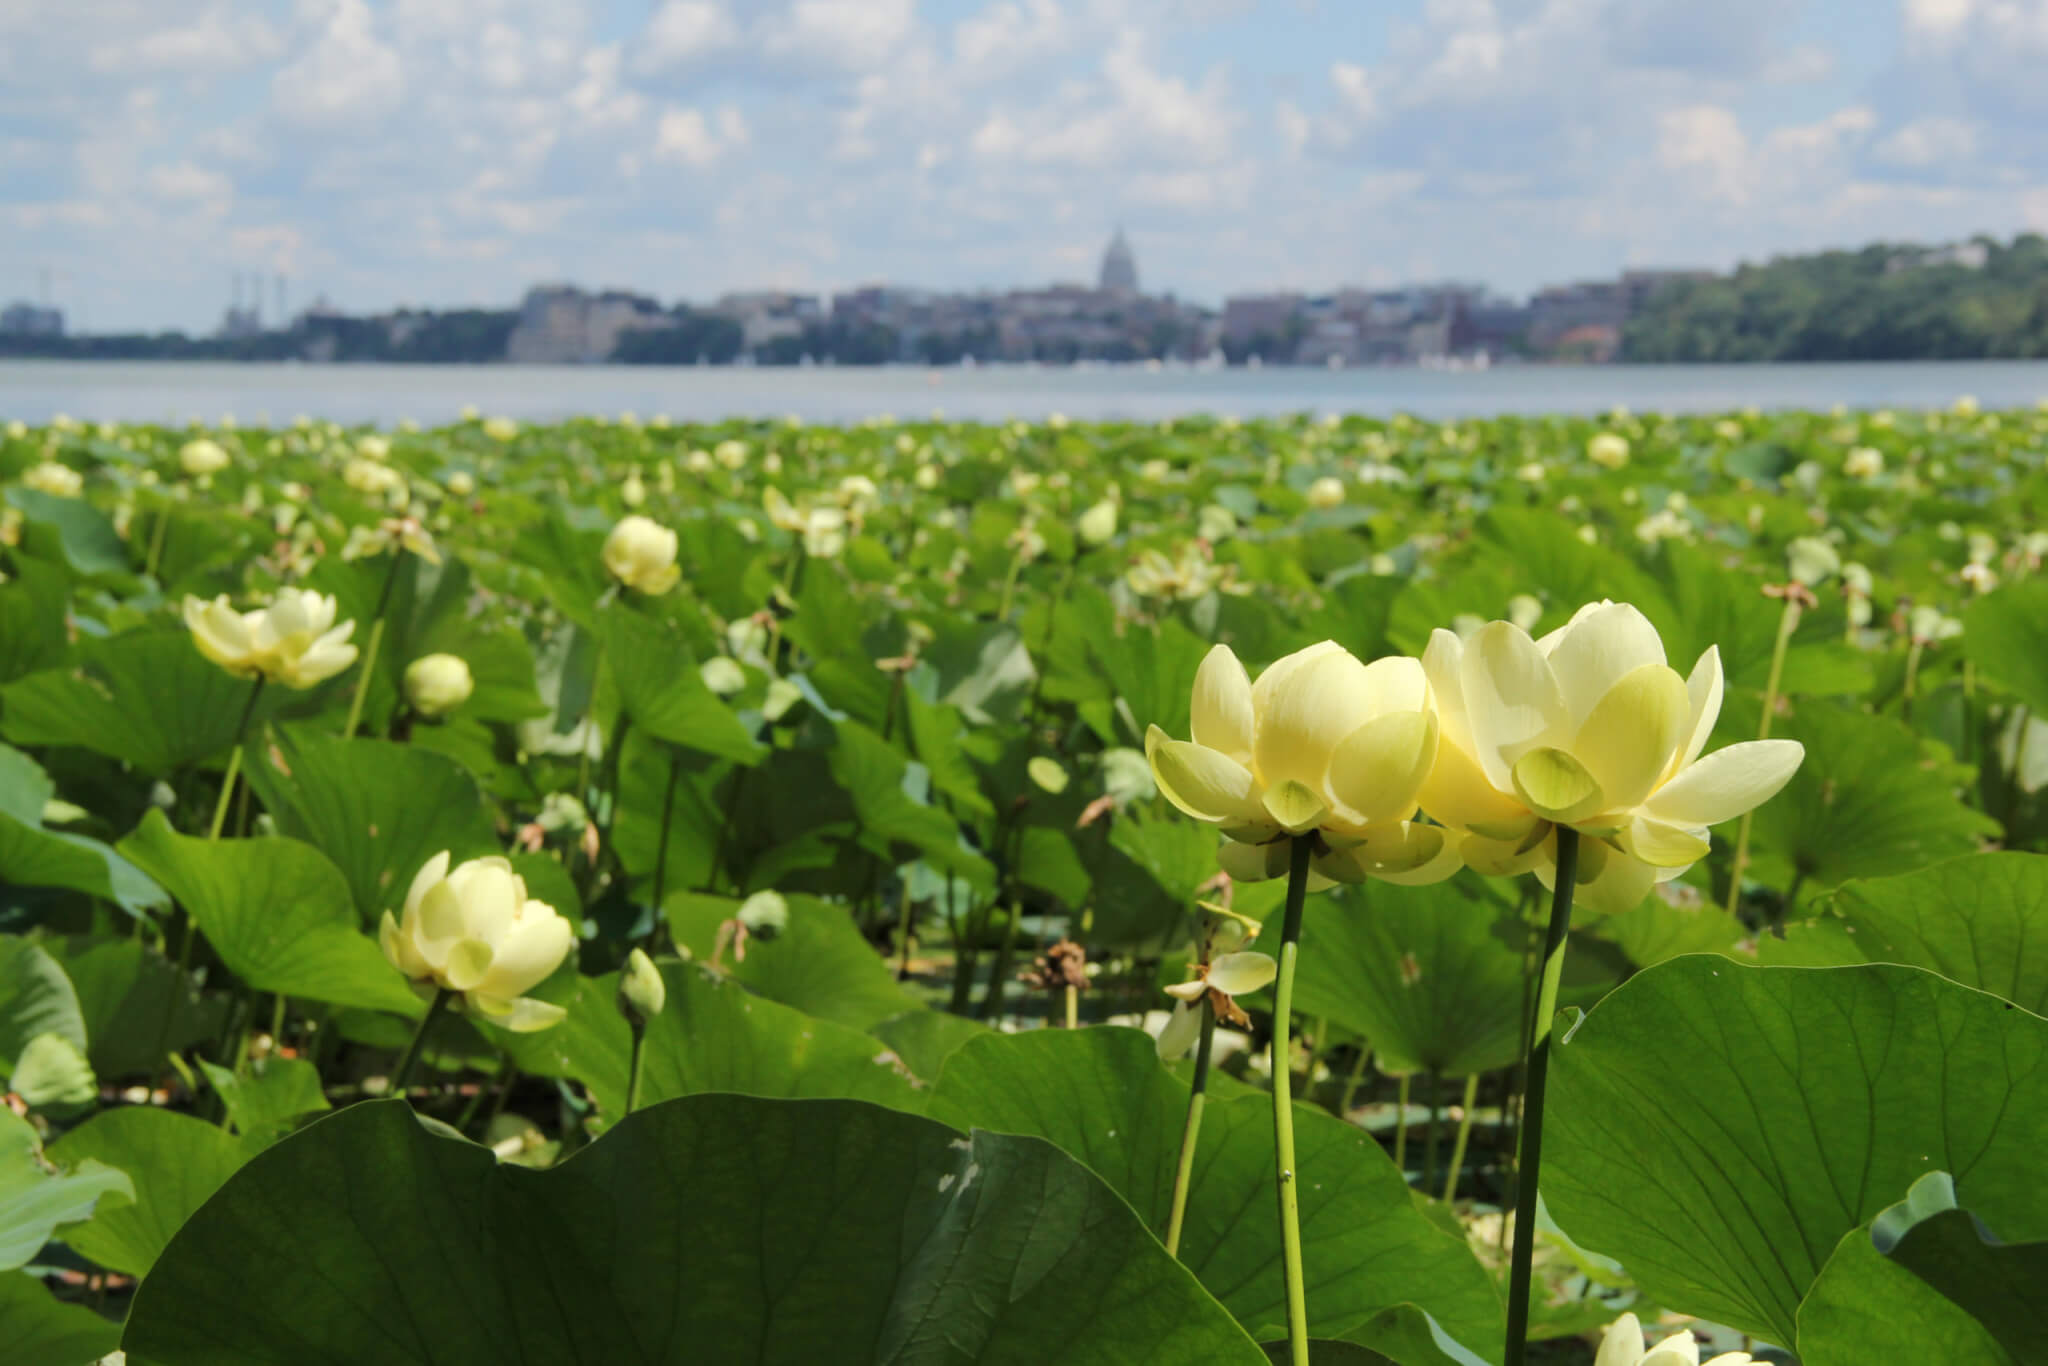
The Yahara River Watershed (map left) begins in the headwaters of the Yahara River in Columbia County and flows south through Dane County for 62 miles, encompassing Lakes Mendota, Monona, Wingra, Waubesa, and Kegonsa, before the Yahara River empties into the Rock River in Rock County. A watershed is defined by the part of the landscape that channels rainfall and snowmelt to creeks, streams, and rivers that flow into a single waterbody, like a lake.
The Yahara River Watershed is home to a fast-growing population and some of the most productive farmland in the United States. The intersection of productive farms and growing urban areas poses a unique challenge as residents and government work together to protect and improve water quality in the chain of lakes.
2018 State of the lakes
2018 was an eventful year for our lakes. Flood conditions and massive cyanobacteria (blue-green algae) blooms made lake use difficult and sometimes dangerous for recreation. According to Dr. Jake Vander Zanden, Director of the UW Center for Limnology, “Conditions in the lakes this year show that we are fighting an uphill battle and things are getting worse in many ways.”
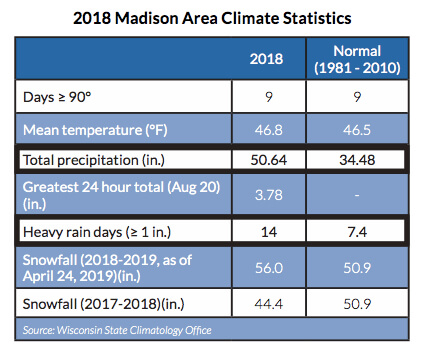
As a region, we are experiencing greater amounts of precipitation and intense storm events compared to previous decades. 2018 was the second wettest year on record, with 50.64 inches of precipitation recorded at the Dane County Airport, surpassing the normal amount by over 16 inches.
Heavy rain events over one inch were also high, with 14 heavy rain days compared to the normal amount of 7.4 (outlined in the 2018 Madison Area Climate Statistics graphic). This change in the region’s climate, along with factors such as invasive species and changing land use, are making it more difficult to meet water quality goals for the lakes.
Phosphorus runoff
Lake Mendota is the largest of the lakes in the Yahara Watershed and the one with the biggest land area. Lake conditions influence the other lakes in the chain and help tell the story for all of the Yahara lakes.
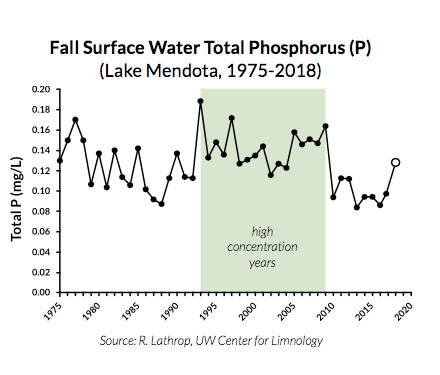
In 2018, the Lake Mendota story starts with the concentration of phosphorus in the fall of 2017. The Fall Surface Water Total Phosphorus graph shows that concentrations were relatively low in the lake during fall turnover, which is when the lake mixes from top to bottom due to temperature changes in the water. This is the time when phosphorus concentrations are most uniform in the lake.
Since 2010, concentrations have been relatively low. In 2018, concentrations went up, but not as high as many other high concentration years during 1993-2009.
Winter rain washes phosphorus into lakes
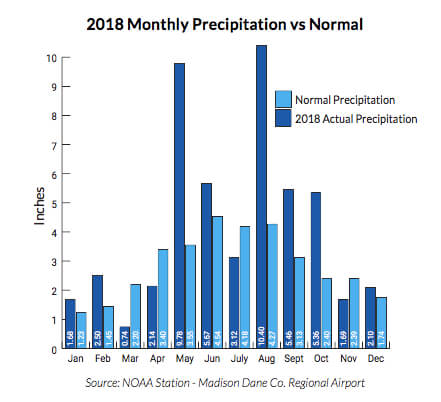
The story continues into early 2018. The 2018 Monthly Precipitation vs Normal chart includes rain events from January and February 2018. Even though the rain events were small in comparison to May and August, they had a significant impact. Rain that falls when the ground is frozen quickly runs off the land, carrying melted snow and phosphorus into the nearest waterway.
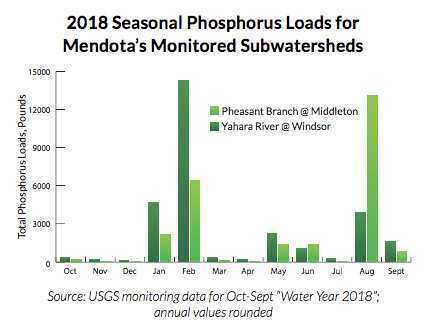
The Seasonal Phosphorus Loads for Mendota’s Monitored Subwatersheds chart shows a large amount of phosphorus delivered in January and February into Pheasant Branch Creek and the Yahara River, which flow into Lake Mendota.
These winter loads, plus additional phosphorus from spring runoff, delivered a large amount of phosphorus to the lakes. Then, hot, calm weather combined with all the phosphorus in the Yahara lake system, led to massive cyanobacteria blooms in June. As the June blooms dissipated, other cyanobacteria blooms, in conjunction with E. coli bacterial contamination delivered primarily from urban storm sewers, continued to close beaches.
Record beach closures
Looking at beach closures from Memorial Day to August 20th, the day of a massive rain event, we experienced a record 162 beach day closures on all five area lakes. Most of the closures were due to cyanobacteria blooms (72%) during this period.
Heavy rains in August led to flooding around all our lakes. The high water, safety concerns, and possible E. coli bacterial contamination led Public Health Madison & Dane County to close all beaches for the remainder of the season. As a consequence, we lost an additional 221 beach days.
To put this into context, we normally have 99 beach days at each of our beaches from Memorial Day to Labor Day. Multiplying this by the number of beaches we include in this report, 17, we could have 1,683 total beach days in the summer. Beaches were closed a total of 383 days, or 23% of the 2018 summer season. The median number of closure days from 2010-2018 is 99, or 6%. We lost almost a quarter of our beach season in 2018!
Annual phosphorus loading
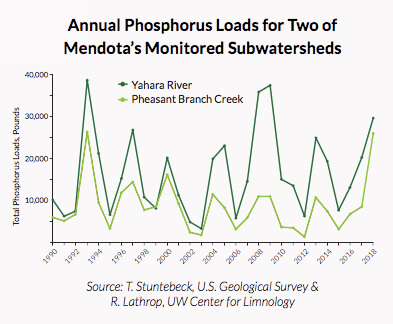
Phosphorus loading in Pheasant Branch is generally lower than the Yahara River, which has a bigger watershed. The relatively small difference in the 2018 phosphorus loads can be explained by the disparity of rainfall from the August 20-21 storm event: 10.63” at the Pheasant Branch rain gage versus 3.92” in the Yahara River as measured at the Dane County Airport.
Debate about the future of our lakes
The flood conditions and massive cyanobacteria blooms have sparked renewed debate about the future of our lakes. To help answer these concerns, at the direction of our Clean Lakes Alliance Community Board, we have reset our strategic action plan for the lakes, Plan 2020: A Clear Path Forward. The plan includes a new focus on reevaluating the actions needed to meet our water quality goals.
According to City of Madison Engineer Greg Fries, “The historic flooding in Madison and surrounding areas this summer (2018) points to the need to reconsider how we, as a community, design new developments, manage our lakes, and think about the extremes of our weather patterns now and in the future.”
2018 report card
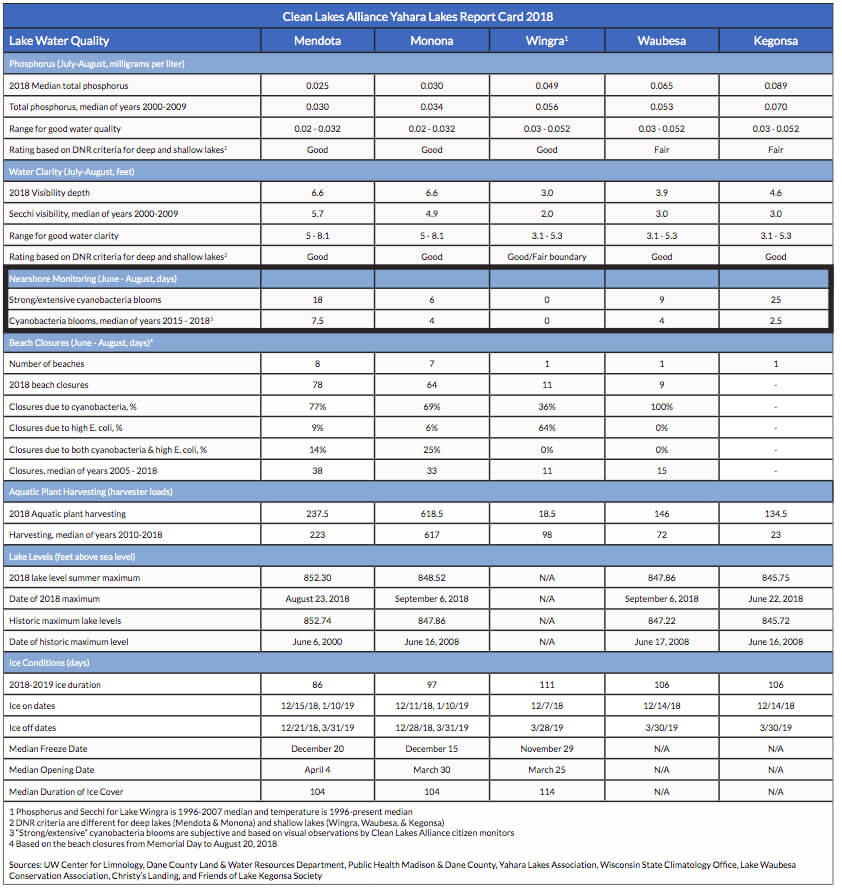
The 2018 Yahara Lakes Report Card includes a new category to highlight the differences between middle of the lake and nearshore water quality. This new category, “Nearshore Monitoring,” is outlined in report card below. The report card includes information from Clean Lakes Alliance volunteers who monitored beaches and other access points at least once a week throughout the summer season. With this new category, we can now compare middle of the lake to nearshore conditions.
In the summer of 2018, the bigger lakes, Mendota and Monona, had “good” water quality in the middle of the lake. However, citizen and public health reports of cyanobacteria blooms and flood conditions led to a record number of beach closures.
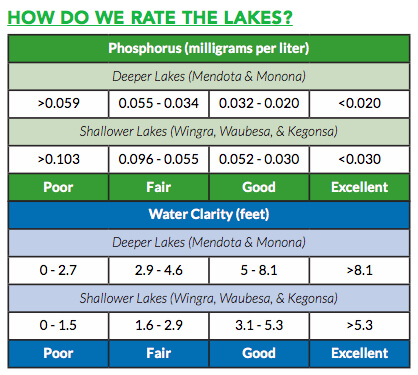
Determining phosphorus and water clarity
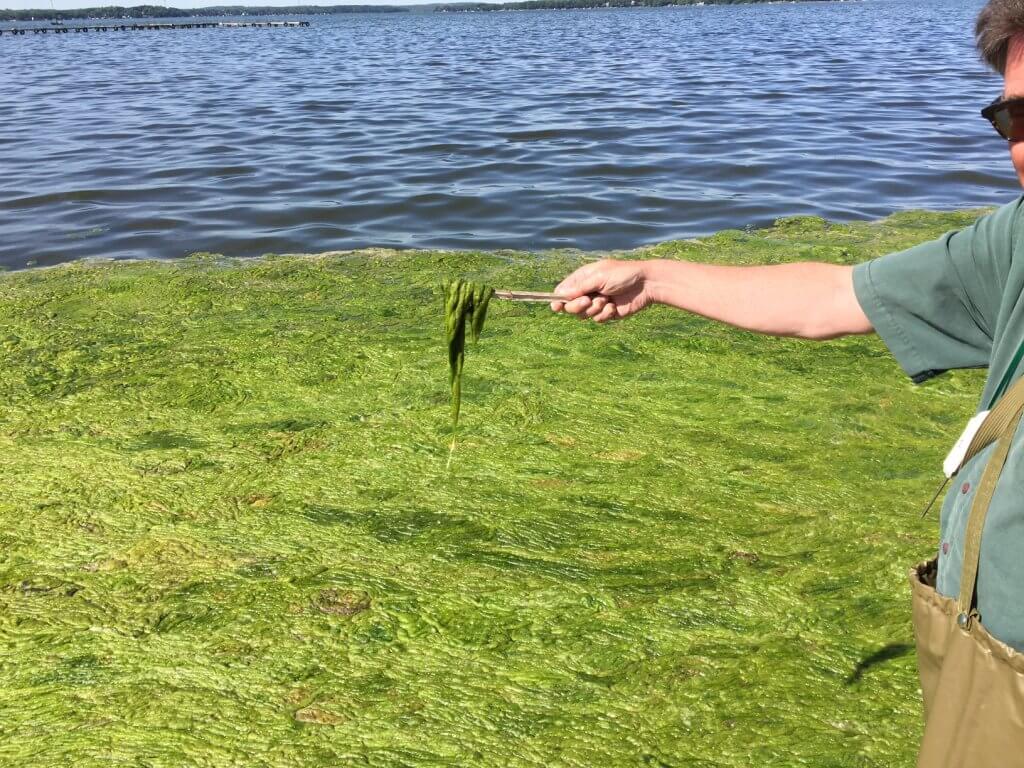
Previous reports have used the term “blue-green algae” to describe algae blooms that are potentially toxic and can close beaches. This report replaces that term with “cyanobacteria.” This term better describes the organism, which is an aquatic photosynthetic form of bacteria that can look blue- green and can sometimes appear as a paint-like scum on the water surface. In fact, cyanobacteria blooms and scums can take on a variety of colors including white, green, brown, and blue, with a hue that is sometimes “cyan” (blueish-green).
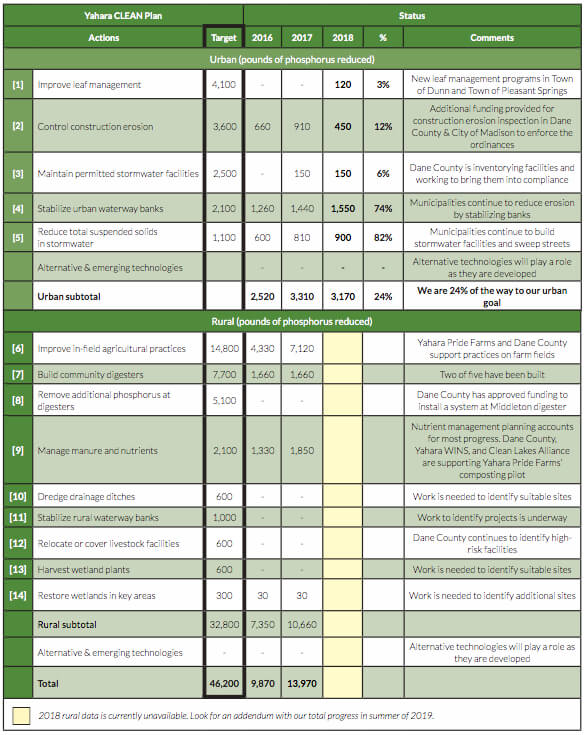
50% phosphorus reduction needed to clean up the lakes
The Yahara CLEAN Strategic Action Plan for Phosphorus Reduction includes 14 actions. The actions are designed to meet a UW Center for Limnology recommendation for a 50% reduction in the average annual phosphorus delivered during 1980-2008 to each of the lakes.
In 2018, the community continued to put in practices in both urban and rural areas to reduce phosphorus runoff. Farmers are adopting best management practices with the support of Yahara Pride Farms, Dane County Land and Water Resources Department, and the Yahara Watershed Improvement Network’s (Yahara WINS) adaptive management project.
In urban areas, municipalities have put in stormwater facilities, restored and maintained wetlands and natural areas, addressed erosion in urban streams, and educated the public on the need to keep leaves out of the street. These actions need to accelerate if we are going to meet our water quality goals for the lakes.
What is phosphorus?
Phosphorus is a naturally occurring element and essential plant nutrient. It can be found in materials such as fertilizer, leaves, soil, and animal waste. When phosphorus enters our lakes from agricultural and urban runoff, it is known to promote the growth of cyanobacteria blooms. The blooms can produce toxins of human health concern.
Scientists have determined that one pound of phosphorus can lead to the growth of 500 pounds of wet algae. The blooms cause beach closures and soupy green water that limit enjoyment of the lakes.
What causes cyanobacteria blooms?
When sufficient phosphorus in the lake system combines with hot, calm weather, conditions for a cyanobacteria bloom are established. Food web changes in the lakes can also contribute to cyanobacteria blooms. The UW Center for Limnology discovered the non-native zebra mussel in Lake Mendota in 2015.
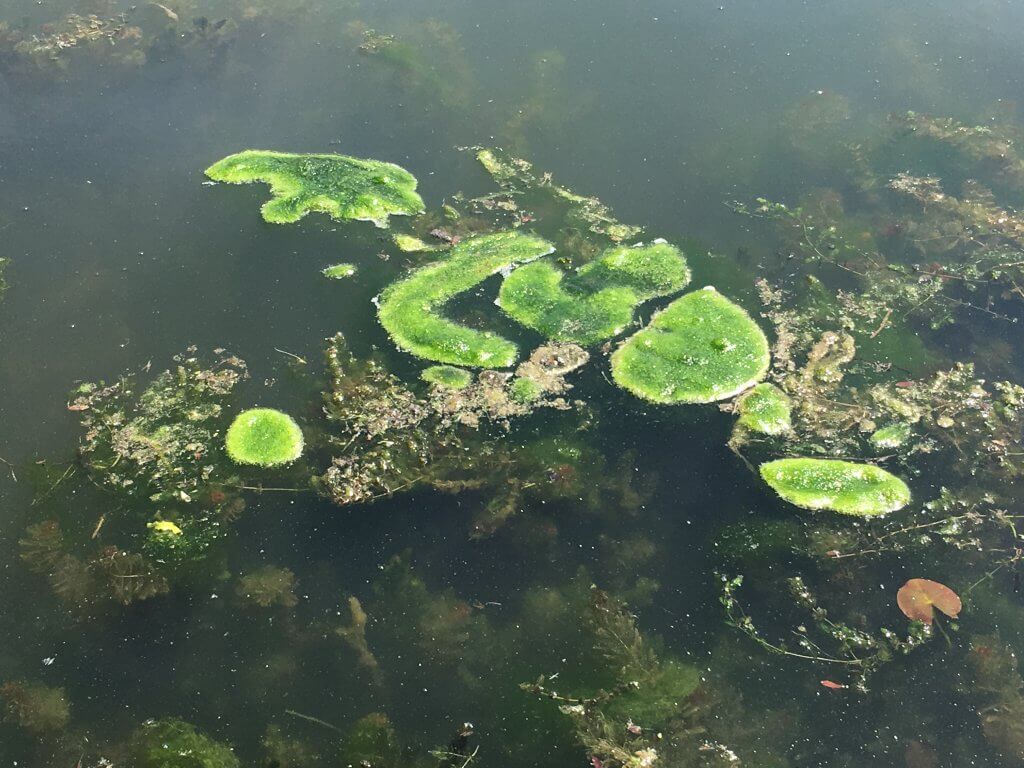
Although scientists are still studying the impact of the zebra mussel invasion, they do know that zebra mussels filter out small forms of free-floating algae (phytoplankton) and that large populations in other lakes have created shoreline management problems. These problems include increased aquatic plant growth (from clearer water) and increases in cyanobacteria scums and filamentous algae, which grows on the lake bottom and looks like slimy, green moss.
Courtesy Joe Campshure
Courtesy Joe Campshure and Terri Lefebvre
Zebra mussels in the Yahara lakes may create conditions benefitting the growth of cyanobacteria. If these conditions develop, we can likely expect more summers like 2018 (147 days of beach closures due to cyanobacteria). You can learn more about these ecosystem changes from the UW Center for Limnology or on our lake ecology webpage.
Cyanobacteria in our lakes
Clean Lakes Alliance citizen monitors work all summer (May – September). They monitor beaches and other access points throughout the Yahara River Watershed. Their work provides an early warning system for lake users and alerts officials at Public Health Madison & Dane County about the possible need to test beaches. These observations are available to the public through lakeforecast.org.
June 28, 2018
The map below shows a snapshot of the water quality monitors’ work. It captures the impact of a massive cyanobacteria bloom in Lake Mendota on June 28, 2018. Two reports of cyanobacteria blooms were reported on lakeforecast.org at approximately 8:00 AM. By the end of a warm day with calm conditions, a program record of 12 reports had been documented across the lake, indicating a massive bloom.
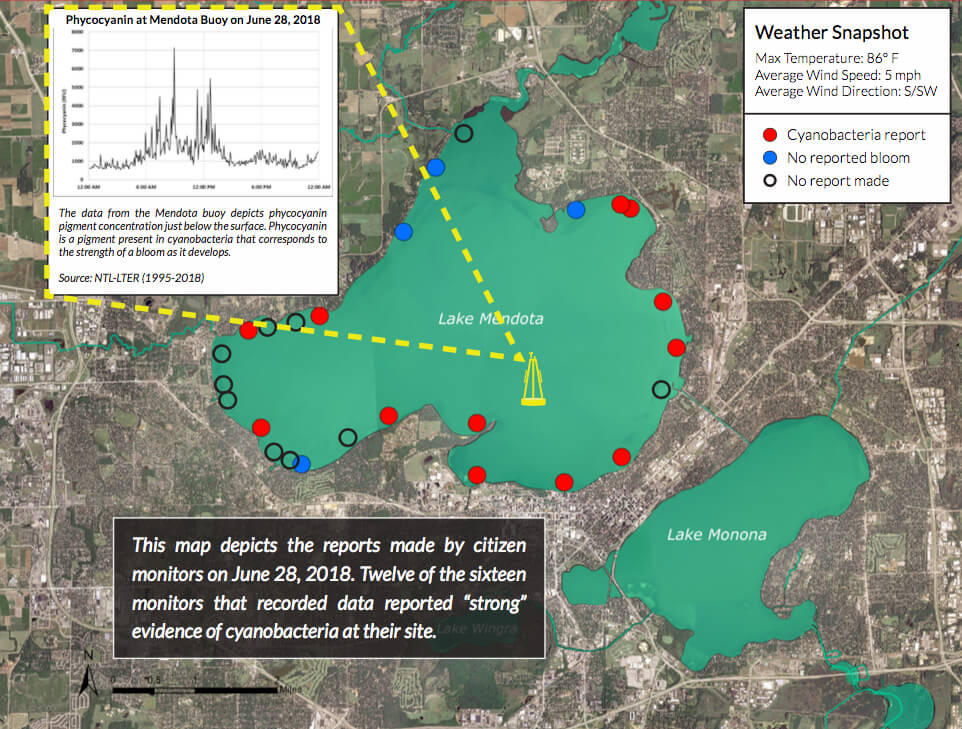
(All reports of cyanobacteria blooms made by volunteer monitors on June 28, 2018)
Buoy data from the middle of the lake are included to show the timing and extent of the bloom development. The buoy is maintained by the UW Center for Limnology. Measurements of phycocyanin, a pigment found in cyanobacteria that increases as cells reproduce and accumulate, are shown on the inset line graph. The graph confirms the extent of the bloom into the middle of the lake as phycocyanin increased from 6:00 AM to around 2:00 PM.
The red dots on the map show how the bloom developed along the shoreline. Our citizen monitors observed extensive evidence of surface cyanobacteria accumulation over the majority of the sampling area at 12 nearshore points. This bloom is part of a trend we have noticed over the past four of the six years that citizen monitors have been making observations. More cyanobacteria blooms are reported by trained citizen monitors (but not verified by Public Health via tests) in June than in any other month.