Clean Lakes Alliance applauds Dane County lake project
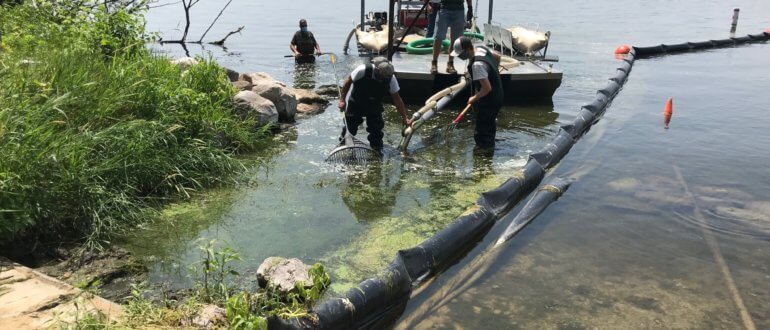
Clean Lakes Alliance is excited to share news about Dane County’s continued focus on improving water quality. In early July, Dane County Executive Joe Parisi, in conjunction with the Dane County Land and Water Resources Department, unveiled new lake technology.