Yahara Lakes 2018 Water Quality Monitoring Results
Overview
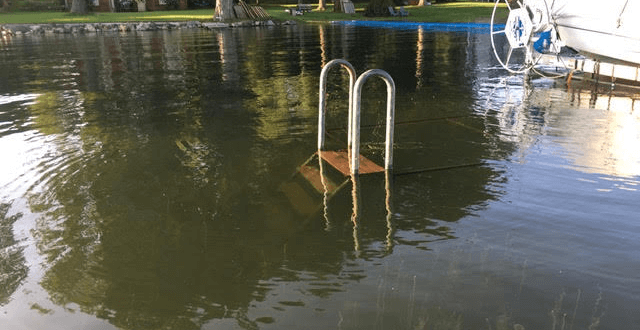
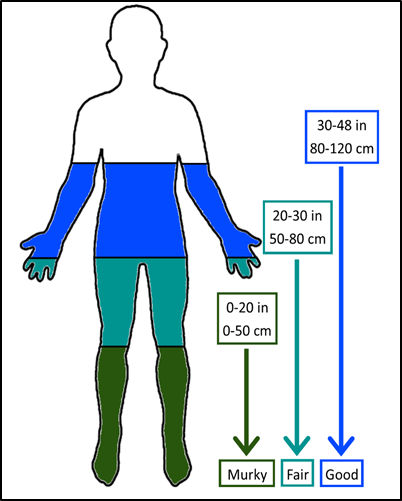
From May to September of 2018, water quality monitoring took place at piers and beaches around the five Yahara lakes. Volunteers measured near-shore water clarity, air and water temperature, and noted several visual observations. Visual observations included presence of algal blooms (green/blue-green), floating plant debris, swimmers, waterfowl, wave intensity, and general water appearance. Volunteers report conditions on our website, Lakeforecast.org. The website displays updated data in real time.
Highlights
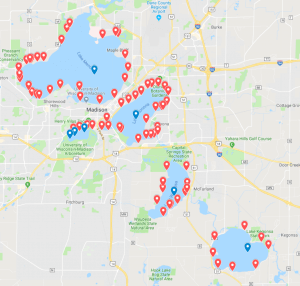
- 79 near-shore and 7 offshore monitoring stations on all five Yahara lakes (Figure 1)
- Weekly off-shore measurement of Secchi depth on all five lakes
- Measured temperature and dissolved oxygen profiles on all five lakes (seven sites total)
- Weekly monitoring continued at all 25 public beaches
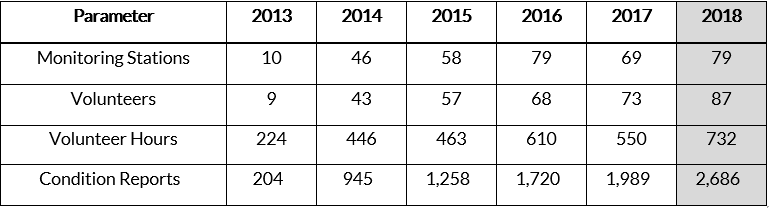
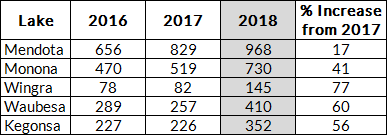
- 44% increase in number of condition reports from 2017 (Table 1)
- Collected continuous near-shore temperature measurements at 17 sites on lakes Mendota, Monona, and Waubesa, and Kegonsa
- Implemented E. coli sampling and cyanobacteria toxin testing pilots
- Averaged 2.3 condition reports per site each week across all sites
- Continued weekly Weekend Lake Reports with over 77,000 views on social media
Algal Blooms
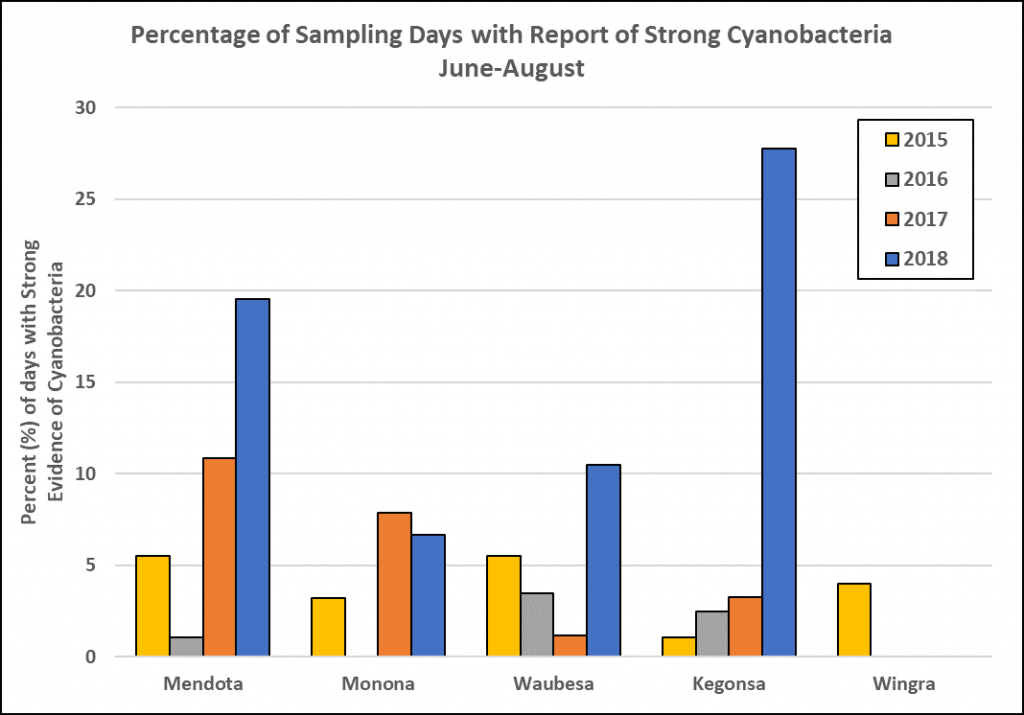
This year, Clean Lakes Alliance used a different approach to summarize reports of cyanobacteria throughout the season. With large variations in sample size and sampling frequency between years, it is difficult to make meaningful comparisons using a simple count of reported blooms. Therefore, we chose to summarize the number of days when a strong cyanobacteria bloom was reported for each lake. By comparing the number of ‘algal days’ to the total number of unique sampling days for each lake, we can generate a percentage that better represents the number of blooms witnessed each year (Figure 3).
Compared to 2017, monitors reported more “strong” cyanobacteria blooms on lakes Mendota, Waubesa, and Kegonsa. In particular, Lake Kegonsa reported a cyanobacteria bloom in almost 28% of all the days when visual observations were reported. In contrast, Lake Monona reported fewer blooms, and Wingra continued to have no reports of “strong” cyanobacteria blooms.
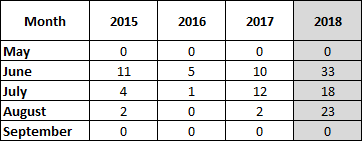
June had more reports of “strong” cyanobacteria blooms than in any other month (Table 2). This trend has remained consistent over the past four years. As temperatures rise and rainfall continues to transport nutrients, cyanobacteria activity increases. September blooms are likely underreported due to a decrease in monitoring activity. Additionally, almost half of the reported blooms in August were witnessed on Lake Kegonsa.
Climate Summary
Greater Madison experienced significantly more rainfall in 2018 than in 2017. Much of this increase occurred in late spring and late summer. Storm events in late August brought a record 8.76 inches of rain in 24 hours. The winter of 2017-2018 was also comparatively colder with Lake Mendota freezing for 94 days, as opposed to 65 days during the winter of 2016-2017. The average ice-on duration for the past 163 years is 102.5 days.
Clarity
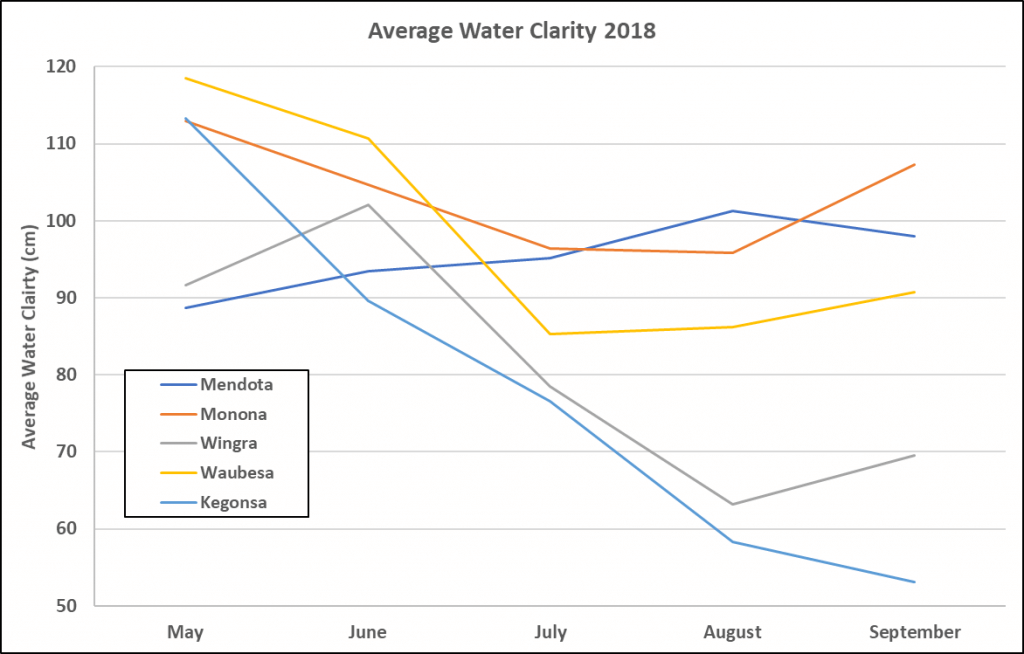
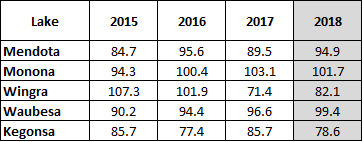
Clarity readings averaged across each lake suggest a general improvement in nearshore water clarity when compared to last year (Figure 4). 2018 clarity readings displayed similar levels seen in 2016, which is an improvement over last year’s decline (Table 3). Only Lake Kegonsa reported a more significant decline in average water clarity. The data show Lake Kegonsa did not experience an improvement in water clarity in September. (Figure 3).
Late season clarity readings tend to improve due to reduced rainfall and decreased biotic activity. This phenomenon may have been delayed by the intense late August rainfall and a higher volume of water accumulating at the lower end of the lake chain. The trend is clearly depicted in Figure 3 for Lakes Mendota, Monona, Waubesa, and Wingra.
More reports than ever before
2018 water quality monitoring condition reports increased on all lakes (Table 2). Waubesa, Kegonsa, and Wingra experienced a significant increase with over 50% more reports than last year. The percent increase in condition reports from 2017 highlights the dedication of our volunteer monitors to increase sampling frequency. In fact, sampling frequency improved from 1.9 to 2.3 samples per site per week across all the monitoring sites. These statistics are even more impressive considering the August flooding that prevented most monitors from sampling for multiple weeks. The continued increase in condition reports will help establish a baseline to compare subsequent monitoring seasons.
Lake Summaries
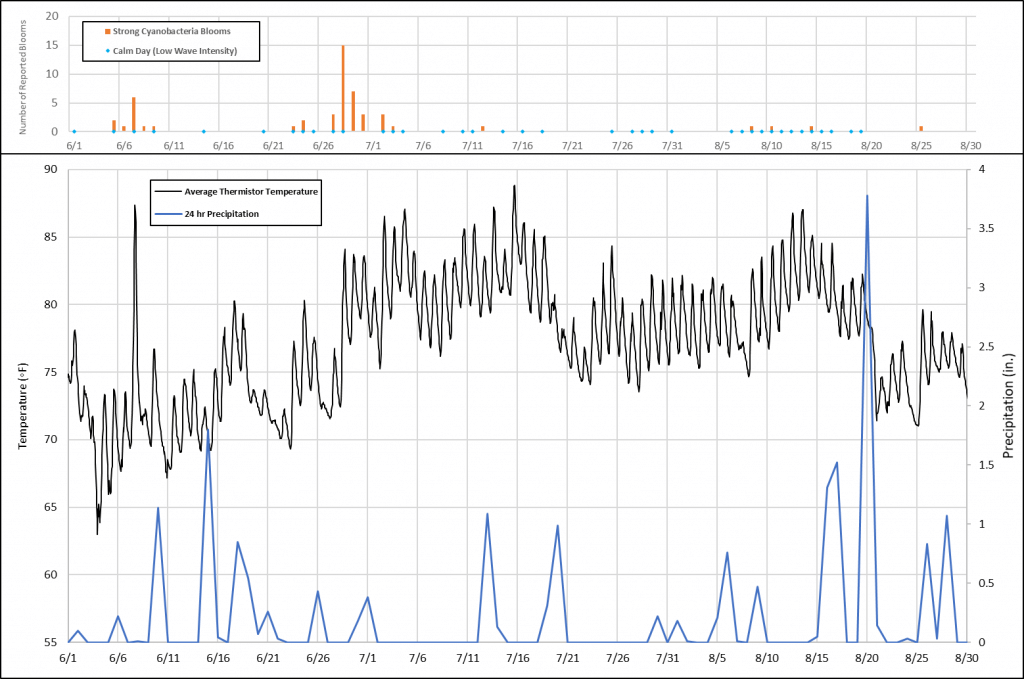
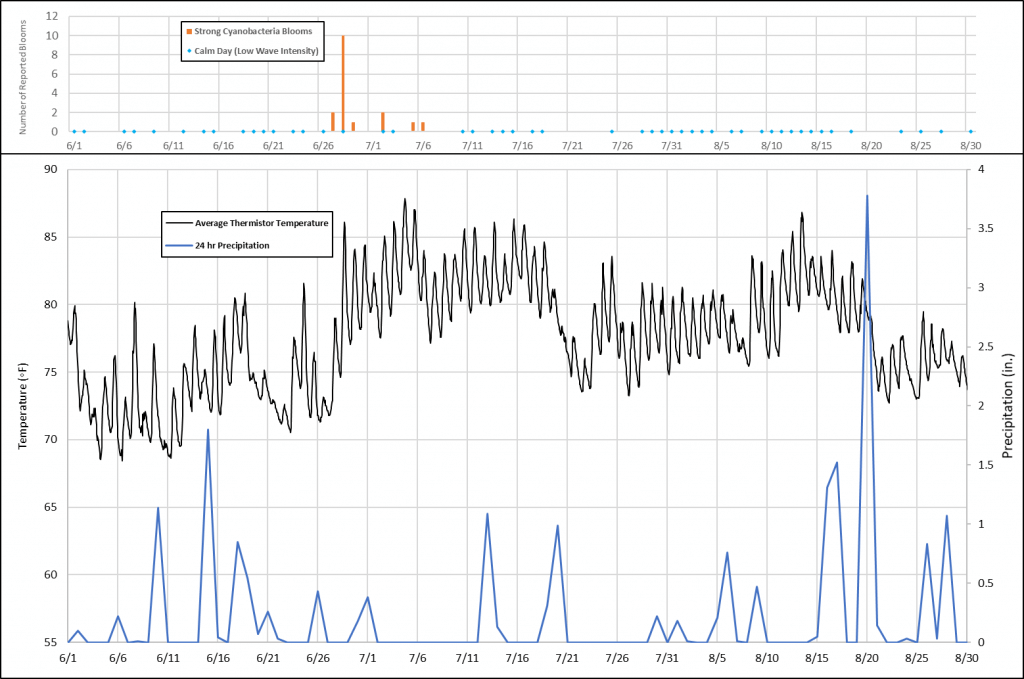
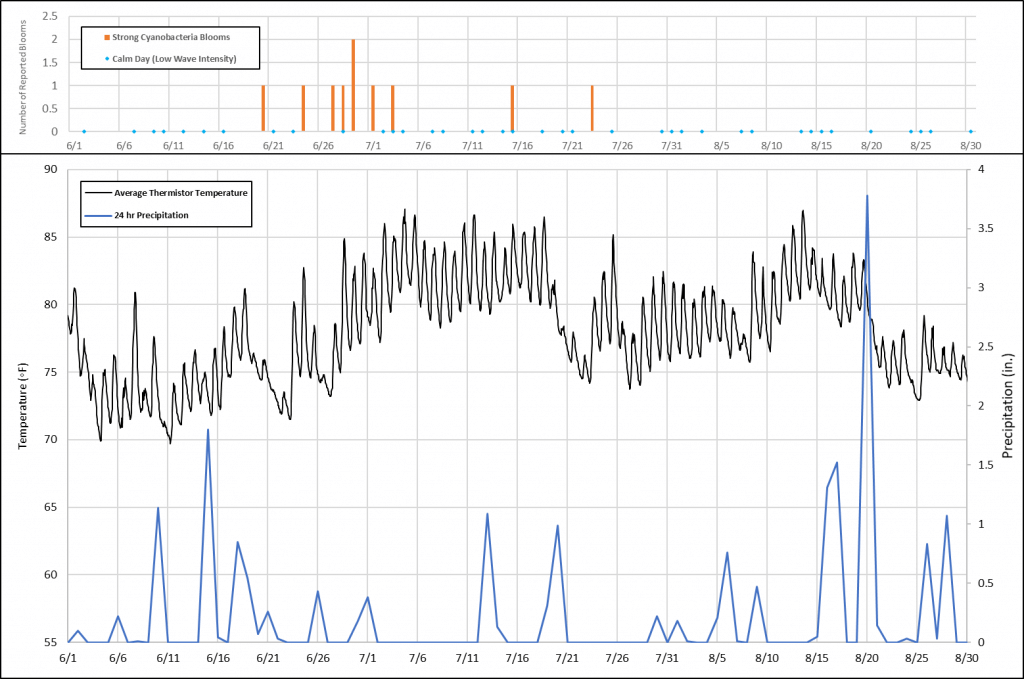
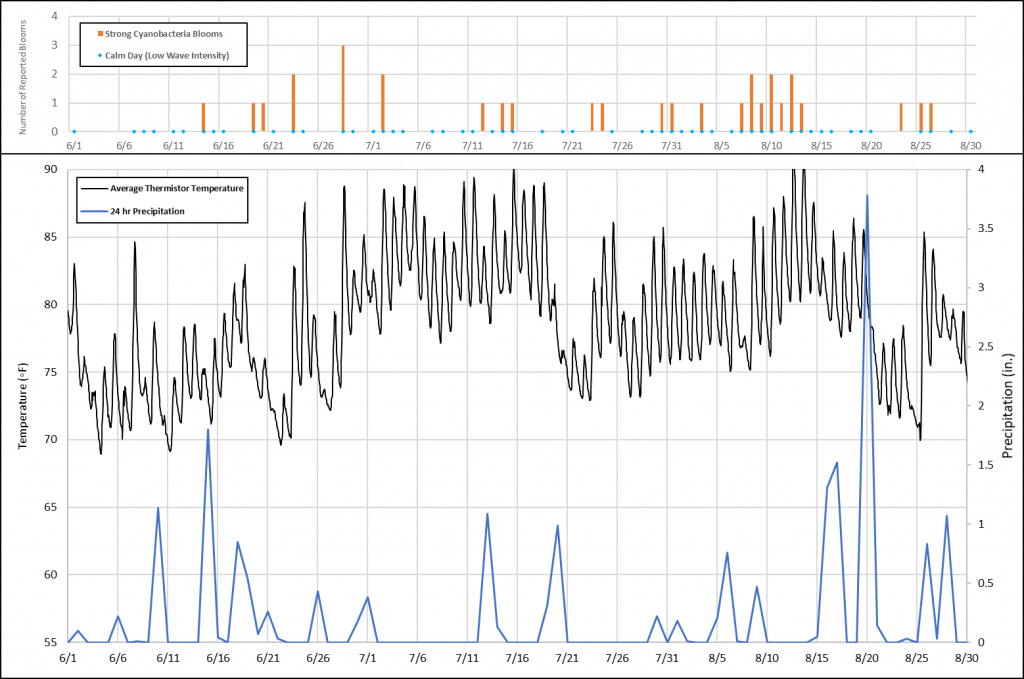
The following charts depict a summary of conditions from June 1st to August 31st on each lake. The bottom portion of the chart displays the average temperature of all hourly thermistor readings on each lake. This provides a generalized nearshore temperature profile for the monitoring season. Additionally, the 24-hr precipitation totals are represented by the blue line.
The rainfall totals were recorded at the Dane County International Airport and obtained from the National Oceanic and Atmospheric Administration (NOAA). The upper portion depicts all reports of “strong” cyanobacteria blooms, and the blue dot represents a calm day, a typical condition advantageous for surface algae accumulation.
2018 lake data
Each graph aids in visualizing the dynamic interactions between precipitation, temperature, wind conditions, and cyanobacteria growth. For example, on Lake Mendota around June 26th, we experienced moderate rainfall followed by increased temperatures and minimal wind. On June 28th, fifteen monitors reported strong cyanobacteria blooms with additional blooms reported the following two days.
While there are additional examples of this phenomenon occurring on the other lakes, it is important to note that cyanobacteria growth is not driven by the simple cause and effect of three variables. The Yahara lakes are part of a dynamic ecosystem consisting of urban and rural inputs, complicated by a changing climate and invasive species. Volunteer monitoring data will continue to be an important part of data driven decision making.
Lake Mendota Summary
Summary of Lake Monona
Lake Waubesa Summary
Summary of Lake Kegonsa
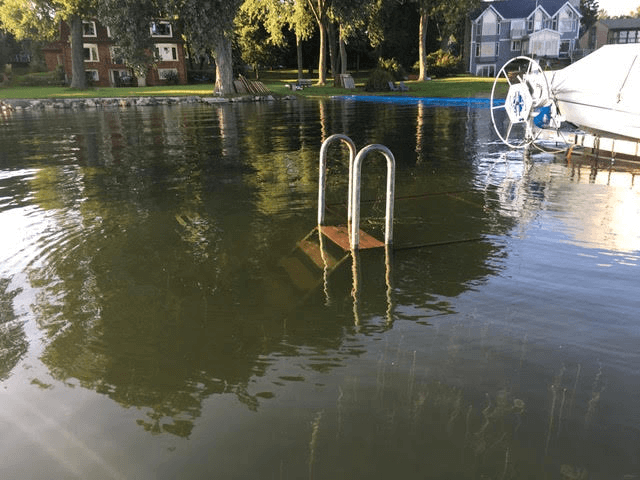
August Flooding
During the latter half of August, a series of storm systems produced torrential rainfall in and around Dane County causing severe weather and flooding (Figure 5). The majority of the rainfall occurred on Monday, 8/20 through the morning hours of Tuesday, 8/21, resulting in major flooding of the Yahara River chain of lakes. Madison received 3.92 inches of rain within 24 hours while communities west of Madison had 11-15 inches of rain.
At the time of the August 20th rainstorm, Lake Mendota was more than a foot above its summer maximum of 850.1 feet above sea level. The additional rainfall and runoff flowing into Lake Mendota increased the lake’s water levels even further, causing the Tenney Park Dam to be at risk of breaching. Opening the dam released a flow of water into the already flooded downstream lakes Monona, Waubesa and Kegonsa. With no available space for extra water in the lakes or the Yahara River, water ended up in storm drains, resident’s houses, and streets on the Isthmus. On the West Side of Madison, flash flooding occurred when the city’s infrastructure was unable to handle rainfall from the August 20th storm.
Flooding response
In response to weeks of historic flooding across the greater Madison Area, the Dane County Board of Supervisors and the Dane County Executive proposed an $18 million budget to aide in flood recovery, prevention and preparedness. The initiative includes $4.5 million to improve water flow on the Yahara River chain of lakes to remove choke points caused by sediment and aquatic invasive plants, $9 million for conservation and stormwater management to reduce water runoff, and millions more for restoration work on streambanks, wetlands and flood impacted parks.
To download a complete version of the 2018 water quality monitoring report for the Yahara lakes, click here.
Read more about our water quality monitoring program.