LakeForecast water quality monitoring in 2025
Clean Lakes Alliance’s LakeForecast water quality monitoring program completed its 13th season in 2025. This program is entirely volunteer implemented, with more than 100 trained monitors assessing water quality conditions from nearshore and offshore locations across all five Yahara lakes (Mendota, Monona, Wingra, Waubesa, and Kegonsa).
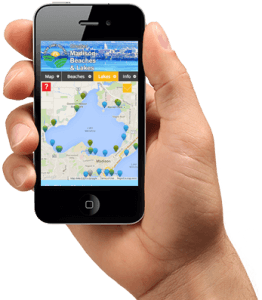
From Memorial Day through Labor Day, volunteers recorded water clarity, air and water temperature, waterfowl presence, the extent of floating plant debris, and the severity of green algae and cyanobacteria at public beaches, lakeside parks, and private piers. Submitted condition reports were able to be tracked in real-time on Lakeforecast.org or our free app, allowing the general public to stay up to date on current lake conditions.
The purpose of the LakeForecast program is to accomplish the following:
- Inform the public about dynamic lake conditions through interactive maps.
- Evaluate how the lakes are responding to changes within the outlying watershed.
- Advocate for the implementation of recommended watershed-improvement actions.
- Support the development of an annual State of the Lakes report outlining conditions, trends, and the water quality drivers affecting the five Yahara lakes.
LakeForecast would not be possible without our dedicated volunteers giving their time and passion to improving Greater Madison’s lakes. Their efforts help highlight the challenges and opportunities around our lakeside spaces, support important public health initiatives at public beaches, and improve our understanding of how our lakes are changing over time. Thank you, volunteer monitors!


2025 Program Highlights
- 75 nearshore and four offshore monitoring stations covering all five lakes (Figure 1)
- All 25 public beaches and swimming sites monitored at least twice per week
- 117 volunteers contributing 1,755 LakeForecast condition reports (Table 1)
- Research in partnership with the UW-Madison Center for Limnology to assess zebra mussel densities
- Research partnership with the Lake Waubesa Conservation Association and Wisconsin Department of Natural Resources for additional zebra mussel density sampling on Lake Waubesa
Results synopsis
In 2025, summer nearshore water quality across the Yahara chain of lakes reflected generally moderate conditions with distinct differences among the individual lakes. Nearshore clarity was highest in lakes Monona and Mendota, moderate in Wingra, and lower in downstream Waubesa and Kegonsa. Cyanobacteria-bloom observations were down compared to recent years, with no significant blooms recorded in Wingra or Waubesa, low frequencies in Monona, and modest levels in Mendota and Kegonsa. In contrast, green algae mats were more prevalent, particularly on the surface of Lake Mendota, while Monona and Kegonsa experienced moderate levels and sightings on Waubesa and Wingra remained relatively low.

Rainfall totals during the 2025 water year were consistent with 30-year averages, suggesting that observed water quality conditions were not strongly influenced by unusually wet or dry weather. Precipitation patterns and the resulting runoff alone are insufficient to explain the conditions observed throughout the monitoring period. Long-term climate trends, annual timing of runoff events, impacts of aquatic invasive species, and the spatial variability of monitoring sites make it challenging to identify system-wide water quality patterns. In addition, watershed-improvement projects aimed at reducing phosphorus delivery to the lakes often have variable lag times before positive lake responses are observed.

Clean Lakes Alliance remains dedicated to improving the water quality of the Yahara chain of lakes through partnership building, advocacy, project implementation, increasing volunteerism, and fostering a culture of watershed stewardship.
Please see Fundamental Concepts on Water Quality of the Yahara Chain of Lakes (Mendota, Monona, Wingra, Waubesa, and Kegonsa)for an excellent summary of our current understanding of lake dynamics. These concepts and understandings are also presented in RENEW THE BLUE: A Community Guide for Cleaner Lakes & Beaches in the Yahara Watershed (2022).
2025 Monitoring Locations


Water Quality Drivers
Rainfall
Based on weather gauge data from the Dane County Regional Airport, rainfall totals for the 2025 Water Year (October 1 to September 30) returned to historic normals after a particularly wet summer over the prior year (Figure 2). Compared to annual calendars, the hydrologic calendar helps better capture the impacts of winter snow accumulation and spring snowmelt on surface waters, providing a more accurate picture of nutrient loading and lake response during the summer season. This helps scientists line up water-quality data with how water actually moves through the system, keeping cause and effect together.

The winter season, particularly January-March, brings the highest levels of phosphorus loading to our lakes, often resulting in increased blooms and aquatic plant growth during the summer season. In fact, as much as 37-48% of phosphorus loading to the Yahara lakes occurs during this three-month period. Luckily, January and February’s precipitation totals were far below average, with only March exceeding the 30-year average. During the monitoring season, May through September’s total rainfall of 22.1 inches was comparable to the normal 21.48 inches over the last 30 years. While we didn’t have excessive rainfall this summer, it’s worth noting that May, June, July, and August each recorded at least one day with rainfall exceeding 1 inch, and some over 2 inches within a 24-hour period. These large “gully washing” rain events contribute to increased soil erosion and stormwater runoff throughout the watershed, impacting water clarity and algal bloom frequency.
Lake Ice
Winter temperatures heading into the 2025 summer monitoring season were warmer compared to the long-term average, contributing to a relatively mild ice season on the Madison-area lakes. During the 2024–2025 winter, lakes Mendota and Monona experienced multiple early freeze–thaw cycles before settling into continuous ice cover. Lake Mendota first froze on December 25, 2024, briefly opened two days later, and then refroze on January 7, 2025, remaining ice-covered until March 15, 2025. Lake Monona froze over on January 5, 2025, and remained frozen until March 15, 2025. Overall, Lake Mendota had 69 days of ice cover and Lake Monona had 79 days — both well below their long-term average of about 102 days, indicating a short ice season compared to historical records.
These durations continue the trend toward shorter ice seasons in recent decades. Earlier ice-out dates and below-average ice cover align with broader patterns of increasing winter temperatures in our region.

A shorter period of ice cover leads to warmer lake temperatures earlier in the year, effectively creating a longer growing season for algae and aquatic plant life. Warmer winters can also lead to greater runoff and phosphorus delivery when wet precipitation falls on frozen soils and cannot soak into the ground. Rather than infiltrate, rainfall can more easily generate runoff that carries manure and other contaminants into receiving water bodies. As mentioned earlier, nearly half of total phosphorus loading through Lake Mendota’s monitored stream tributaries occurs from January to March, making late winter and early spring one of our most vulnerable times for negative water quality impacts.
Water Clarity
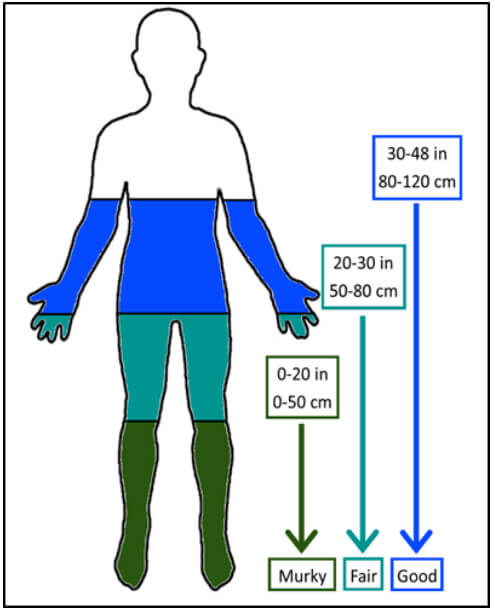
Table 2 below shows the average water clarity recorded on each lake from June 1st to August 31st. Median nearshore clarity in 2025 was comparable to prior-year medians, starting with higher clarity readings in June before declining significantly as the season progressed. Lakes Mendota, Monona, and Wingra all reported water clarity within the “good” range (Figure 4). Meanwhile, lakes Waubesa and Kegonsa fell in the “fair” water quality range.


Seasonal changes affect water clarity
As summer unfolds in southern Wisconsin, many lakes gradually lose their higher-clarity conditions. Early in the season, cooler water temperatures and abundant populations of native zooplankton often result in relatively low algae growth. Zooplankton, such as Daphnia, thrive in cooler water temperatures (55℉ – 65℉) and graze heavily on algae, keeping algal levels low and water clear. As the season advances, zooplankton numbers often decline due to changes in water temperature and increased predation by young fish, reducing this natural grazing pressure. At the same time, sunlight and heat stimulate algae and aquatic plant growth, especially when nutrients such as phosphorus wash into lakes from surrounding landscapes.
Increased boating activity can also stir up bottom sediments in shallow areas, further decreasing clarity. By mid- to late summer, the combined effects of reduced zooplankton grazing, higher algal growth, and lake-bottom-sediment-resuspending recreational activities often make lakes appear greener or murkier than they did earlier in the season.


Cyanobacteria blooms
As part of reviewing this season’s bloom-frequency reports, the same analytical method first adopted in 2018 was used. This approach counts the number of days on each lake where there was at least one report of a strong cyanobacteria bloom observed among the monitoring sites. By dividing the number of ‘cyanobacteria bloom days’ by the total number of sampling days for each lake, a percentage is generated representing how often the monitors observed at least one significant bloom (Table 3). A significant bloom means that the monitor observed strong evidence of a surface bloom covering at least half of their nearshore monitoring location. This method lessens overreporting in situations when different monitors report the same cyanobacteria bloom.

Tracking and comparing cyanobacteria blooms
2025 was a fairly typical monitoring season in terms of reported cyanobacteria blooms compared to prior years (Table 3). Overall, monitors reported fewer cyanobacteria blooms, with every lake reporting a reduction in cyanobacteria blooms compared to the 2024 season. Kegonsa continued to report the highest frequency of blooms, with over 40% of sampling days having significant evidence of a surface bloom reported during the month of August (Table 3). Lake Mendota saw the second-highest reportings, with August being the worst month for surface blooms. Meanwhile, Mendota and Kegonsa saw bloom frequencies increase as the season progressed, while Lake Monona showed the opposite trend. Monona’s highest reported blooms occurred in June and improved as the summer progressed. Monitors on Lake Wingra and Lake Waubesa did not report a single, significant bloom from June 1st to August 31st.

It’s worth noting that Lake Kegonsa monitors are the most active of any lake in the chain, averaging 22 condition reports per monitor in 2025. This compares to Lake Mendota’s 15, Lake Monona’s 16, Lake Wingra’s 12, and Lake Waubesa’s 13 submissions-per-monitor averages. Lake Kegonsa’s higher frequency of reporting, coupled with the fact that all but one of Lake Kegonsa’s monitoring locations are at private piers, likely means that few blooms go unnoticed or unreported.

Green algae blooms
The same analytical method to assess frequency of occurrence was used for green algae blooms as cyanobacteria blooms. This approach counts the number of days on which one or more monitors reported “strong surface evidence” of a green algae bloom at their monitoring stations. By dividing the number of ‘green algae bloom days’ by the total number of days each lake was monitored, a percentage is calculated that more accurately represents the number of blooms observed each year for a given lake (Table 4). This method lessens the chances of over-reporting that could result when different monitors might report the same algal bloom.

Similar to the cyanobacteria bloom reports for this season, monitors also reported a moderate frequency of green algae surface blooms (Table 3). These blooms, which do not produce toxins, are most often the product of filamentous algae accumulations that detach from the lake bottom.

2025 was an historically average year in terms of reported green algae blooms for all lakes but Lake Mendota (Table 3). Lake Mendota experienced an all-time high in observed green algae blooms, with 38% of days having a significant bloom sighted in June. This trend remained strong throughout the summer season, only dipping slightly as the weeks progressed. Lake Kegonsa had significantly higher blooms reported in August, whereas Monona and Wingra reported very few, if any, significant green algae blooms.
Increased algae with phosphorus runoff
Overall, lakes Wingra, Waubesa, and Kegonsa all had fewer green algae bloom reports compared to the prior year (Figure 7). Increased green algae production is common in fertile lakes with high nutrient concentrations, often caused by excessive phosphorus runoff. At moderate levels, green algae and native aquatic plants play an important role in maintaining healthy lake ecosystems. While green algae on its own is not harmful to human or animal health, it can become an unwelcome nuisance when it takes the form of large floating mats that wash up on shore and decompose.

As shown in Figure 8, there has been a considerable difference in the type of blooms reported by monitors from year to year, with noticeably more green algae blooms relative to cyanobacteria starting in 2020. Since 2020, we often see more green algae blooms reported than cyanobacteria blooms, with last year being the outlier. This year saw a dip in cyanobacteria blooms, with green algae blooms once again becoming more prominently reported. The significant disparity between bloom types from last year to this year highlights the complex relationships among weather conditions, phosphorus availability, lake biology, and water quality responses.

Thank you, monitors!
Clean Lakes Alliance wishes to recognize the following volunteer LakeForecast monitors for their many contributions to the success of this program:
Mendota
- Rhonda Arries
- Amy Beczkiewicz
- Monica Begley
- Renee Buchanan
- Henry Clark
- Emily Conklin
- Nancy Ellison
- Robert Gilbert
- Paul Hendrickson
- Valerie Holewinski
- Andy Ippolito
- Lilie Jacoboski
- Julia Kloiber
- Arlene & Jeff Koziol
- Jay Larson
- Jessica LeClair
- Peggy Lee
- Allan Levin
- Linda Malkin
- Mattie Urrutia
- Seth McGee
- Lolly Merrell
- Carol Michalski
- Sam Minor
- Stephanie Ogborne & Jan Eddy
- Anne Pryor & Steve Ackerman
- Stephanie Rathkamp
- Jane Richard
- Jacob Stampen
- Jim Twesme Ian Wegger
Monona
- Doug Bach
- Jill Ball (and Mary Howard, Diane Hall, Julia Bolz, and Mary Worzala)
- Leigh Becker
- Bob Bertera
- Carolyn Betz
- Brittingham Boats
- Erica Eastman
- Claire Finucane
- Amie Francisco
- Rachel Groman
- Michael Leetmaa
- Renee Long
- Mel McCartney
- Grace McClusky
- Paul Miller
- Mary Murrell
- Joy Newmann
- Travis Olson
- Bud Palac
- Jamie Palmer
- Zak Redding
- Tom Smith
- Troop 8315
- Judith Strand
- Jan Van Vleck & Ray Cruz
- Bob Wickem & Lisa Riehl
Wingra
- Steve Glass
- Lisa Grueneberg
- Jess Hankey
- Sally Lehner
- John Nicol
- Sylvia Ramirez
- Andrew Swenson
Waubesa
- Kitty Brussock
- Kenzie Burns
- Sandra Docter
- Andy Graham
- Scott Hangartner
- Margaret and Tom Howell
- Tam Knickmeier
- Ginny Kominiak
- John McIntyre
- Nick Pearce
- Jess Shellenberger
- Adele Sink
- Lori Wallman
Kegonsa
- Sarah Balz
- Bill & Amanda Blank
- John Bottorff
- George Corrigan
- Connie Hagen
- Janice Kellogg
- Mike Krueger
- Deb Kundert
- Ken LePine
- Anne Meisner
- Claudia & Greg Quam
- Peg Stine & Carl Johnson
- Gary Tapper
- Kim & Tom Walz
- Jim Wilcox