LakeForecast water quality monitoring in 2024
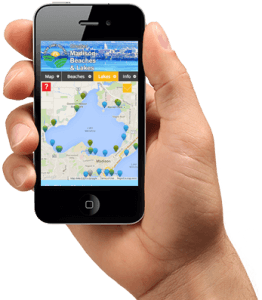
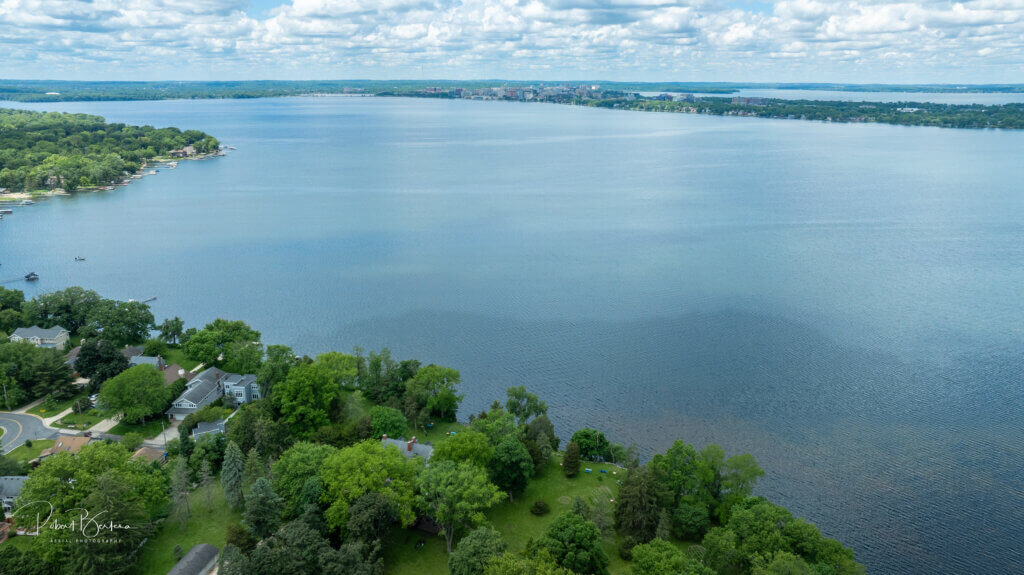
Clean Lakes Alliance’s LakeForecast water quality monitoring program completed its 12th season in 2024. This program is entirely volunteer-implemented, with over 100 trained monitors assessing water quality conditions from nearshore and offshore locations across all five Yahara lakes (Mendota, Monona, Wingra, Waubesa, and Kegonsa). From Memorial Day through Labor Day, volunteers recorded water clarity, air and water temperature, waterfowl presence, the extent of floating plant debris, and the severity of green algae and cyanobacteria at public beaches, lakeside parks, and private piers. Submitted data can be seen in real-time on Lakeforecast.org or our free app, allowing the public to stay up to date on current lake conditions.
Data collected from our monitors is used to advocate for implementing watershed improvement projects, raise additional dollars to protect our waters, and prepare our annual State of the Lakes report outlining conditions, trends, and water quality drivers affecting the five Yahara lakes.
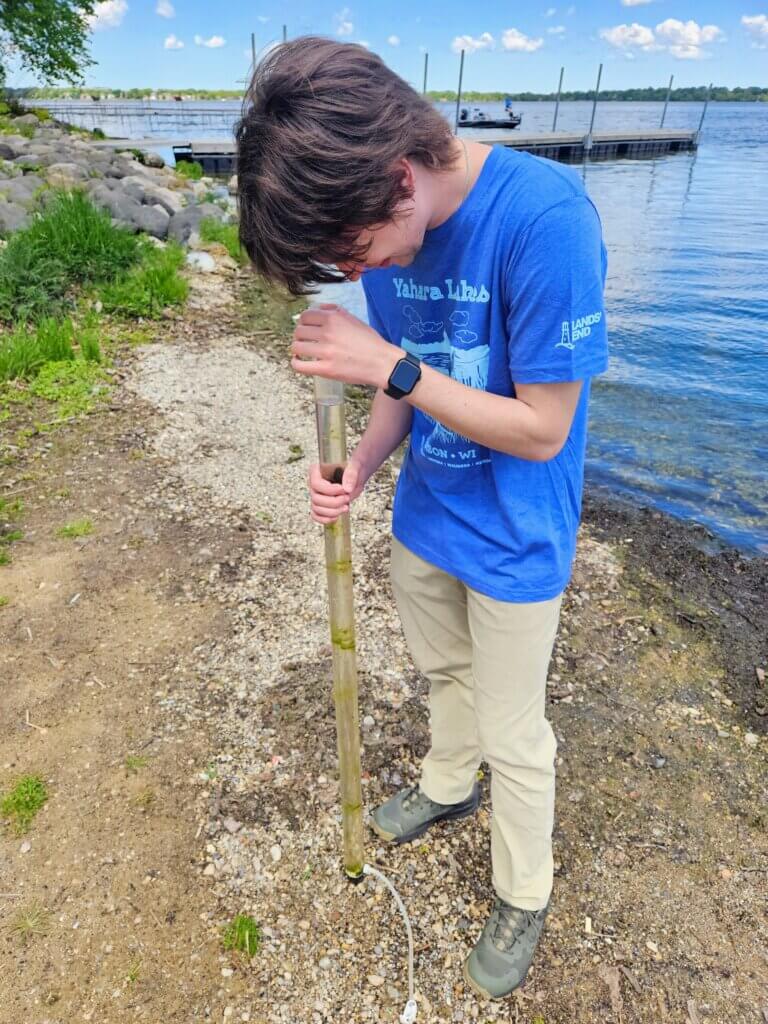
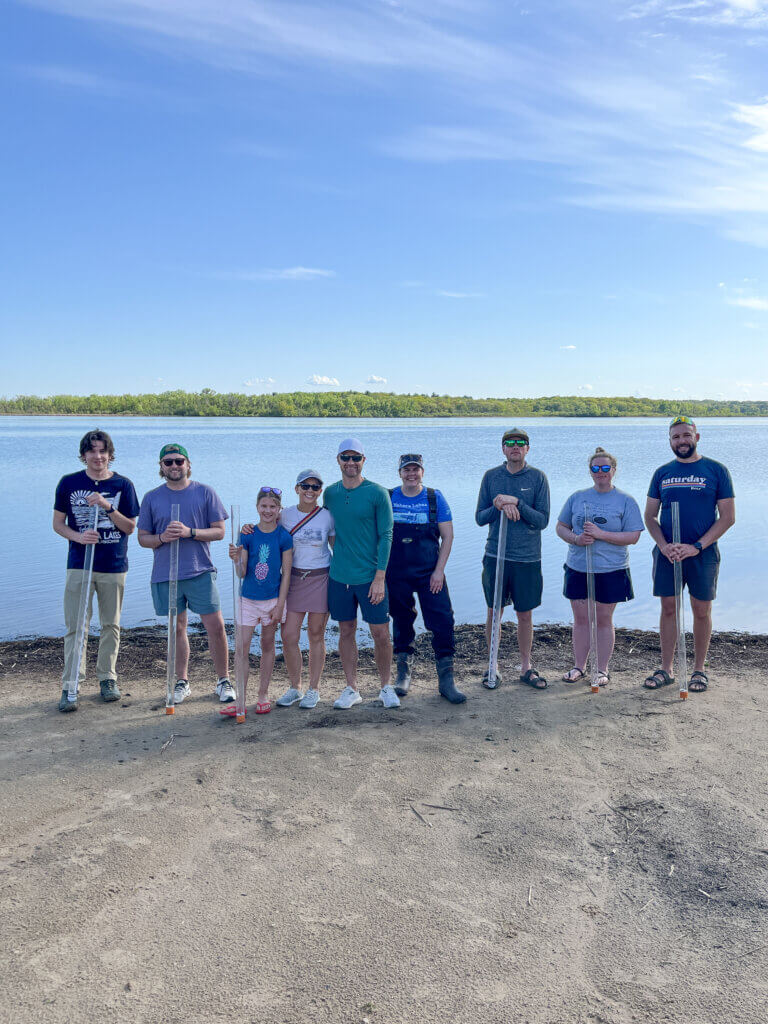
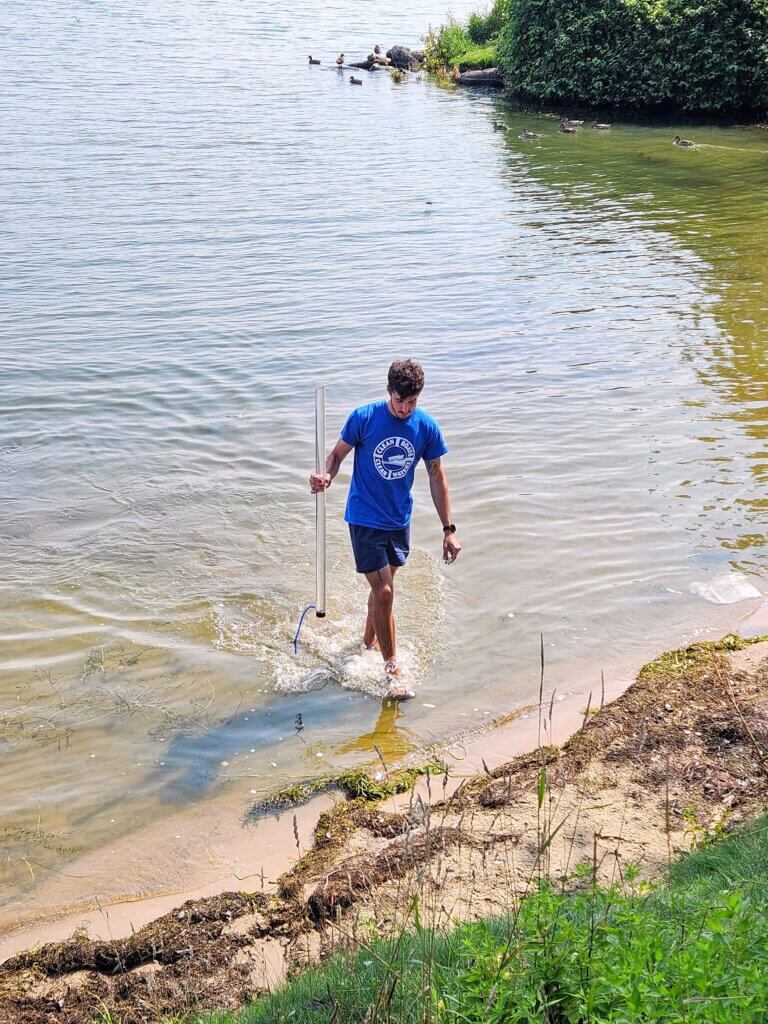
LakeForecast would not be possible without our dedicated volunteers giving their time and passion to improving Greater Madison’s lakes. Their condition reports highlight the challenges and opportunities when it comes to our lakeside spaces, support important public health initiatives at our public beaches, and improve our understanding of evolving lake dynamics. Thank you, volunteer monitors!
2024 Program Highlights
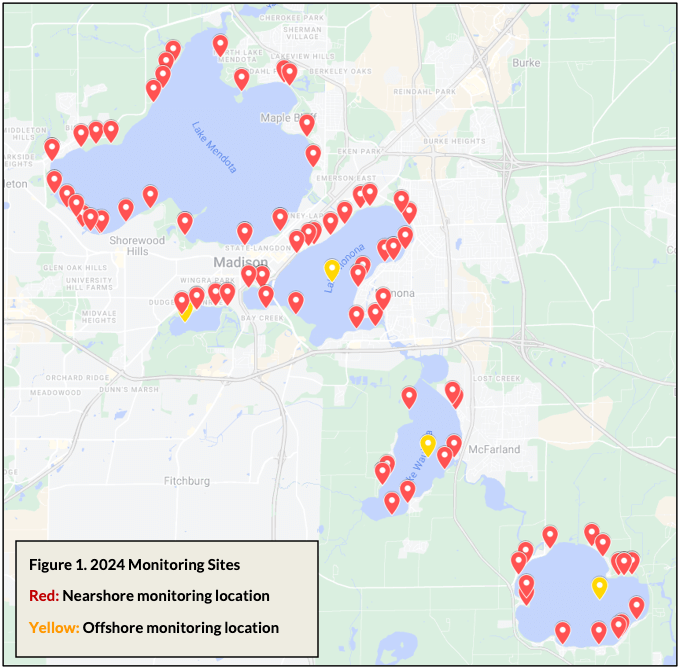
- 81 nearshore and four offshore monitoring stations covering all five lakes (Figure 1)
- All 25 public beaches and swimming sites monitored at least twice a week
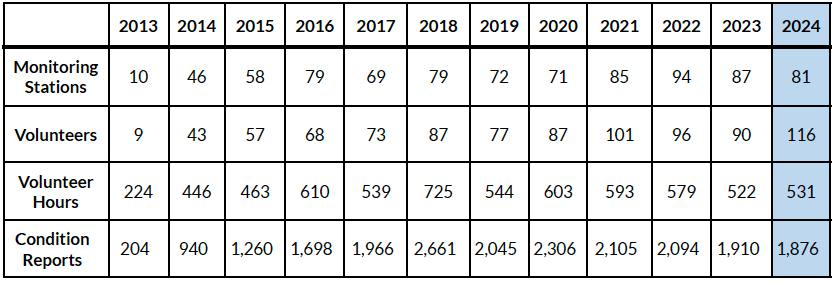
- 116 volunteers contributing 1,876 LakeForecast condition reports (Table 1)
- Cyanobacteria toxin testing in partnership with UW-Madison Civil & Environmental Engineering
- Pilot study in partnership with the UW Center for Limnology to assess zebra mussel densities
- Partnership with the Lake Waubesa Conservation Association and Wisconsin Department of Natural Resources for additional zebra mussel density sampling on Lake Waubesa
Results
SEASON SUMMARY: The 2024 monitoring season was characterized by higher-than-normal spring and summer rainfall volumes and intensities. Increased runoff is shown to deliver more phosphorus to the lakes, fueling greater cyanobacteria blooms and moderate water quality conditions across all lakes. For the first time in LakeForecast history, significantly more cyanobacteria blooms were reported compared to green algae blooms. While 2024 saw the highest number of reported cyanobacteria blooms since 2014, an average number of green algae blooms were reported compared to historical trends.
Identifying patterns in lake conditions
Precipitation patterns alone are insufficient to explain the conditions observed throughout the monitoring period. Long-term climate trends, annual timing of runoff events, impacts of aquatic invasive species, and the spatial variability of monitoring sites make it challenging to identify whole-lake water quality patterns. In addition, watershed-improvement projects aimed at reducing phosphorus delivery to the lakes often have variable lag times before positive lake responses are observed.
Clean Lakes Alliance remains dedicated to improving the water quality of the Yahara chain of lakes through partnership building, advocacy, project implementation, increasing volunteerism, and fostering a culture of watershed stewardship.
Additional readings
Please see Fundamental Concepts on Water Quality of the Yahara Chain of Lakes (Mendota, Monona, Wingra, Waubesa, and Kegonsa) for an excellent summary of our current understanding of lake dynamics. These concepts and understandings are also presented in RENEW THE BLUE: A Community Guide for Cleaner Lakes & Beaches in the Yahara Watershed (2022).
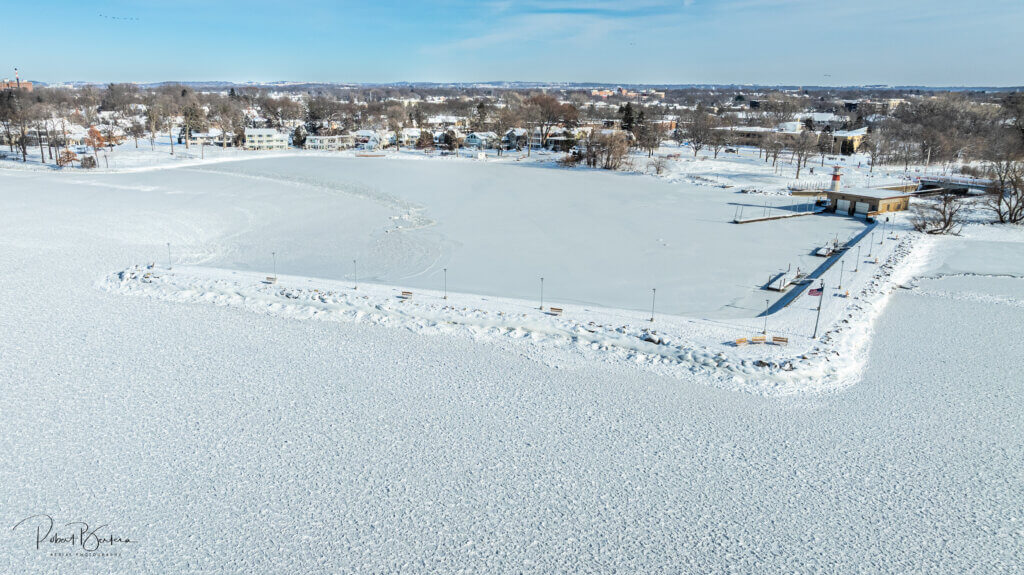
2024 monitoring locations
Water quality drivers
Rainfall
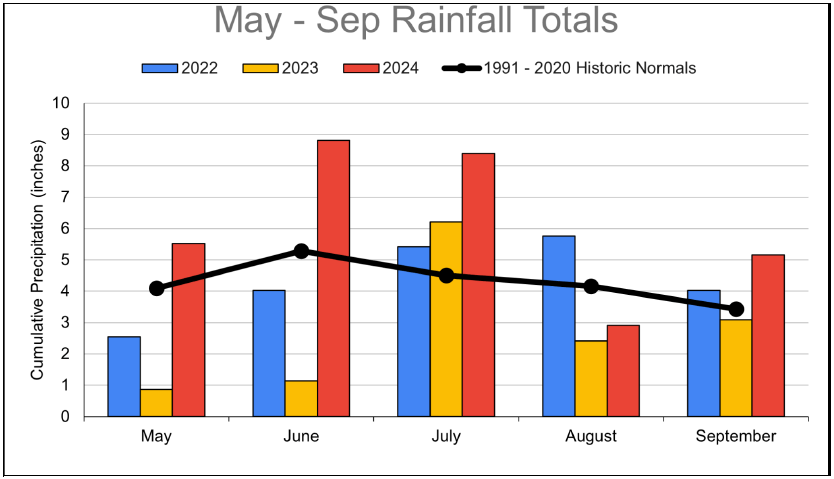
Based on weather gauge data from the Dane County Regional Airport, rainfall totals for 2024 (Figure 2) reflected a very wet start to the monitoring season. May through September’s collective rainfall totaled 30.81 inches, compared to the normal 21.48 inches during this time period over the last 30 years. Between May and September, only August’s monthly rainfall total was below average. Heavy rainfall resulted in high lake levels, far different than last year’s drought conditions and lower lake levels.
Wet conditions in 2024
Additionally, May, June, and July each registered several days with rainfall greater than 1 inch. July experienced significant runoff events, with July 2nd dropping 2.49 inches of rain and July 13th-14th recording 4.69 inches in less than 48 hours, more than the entire monthly average for July (4.51 inches)! These large “gully washing” rain events were frequent this summer, contributing to increased soil erosion and flood warnings throughout the watershed.
This year’s wet conditions speak to the impacts that runoff has on phosphorus loading, water clarity response, and algal bloom frequency. More stormwater moving across our landscape means more opportunity for polluted runoff to wash into our lakes. Because of our unusually warm winter and high rainfall this spring, the lakes likely received higher phosphorus inputs this season, especially in comparison to last year’s drought conditions.
Lake ice
Winter temperatures were well above normal leading into the 2024 summer monitoring season. In late 2023, climatologists noted some of the strongest El Niño conditions on record, giving way to a mild winter. Lakes Mendota and Monona remained frozen for only 44 days (54 days less than in 2023). Lakes Mendota and Monona both froze on January 15th this year, the third latest date on record, and opened on February 28th. This was the shortest duration of ice cover for Lake Monona and the second shortest duration for Lake Mendota in the 169 years the Wisconsin State Climatology Office has collected ice cover data. Notably, the last strong El Niño years were 1982–83 and 1997–98. In the former, Lake Mendota had 54 days of ice cover and opened March 8; the latter had 47 days and opened February 27.
A shorter winter leads to warmer lake temperatures earlier in the year, effectively creating a longer growing season for algae and aquatic plant life. Warmer winters can also lead to greater runoff and phosphorus delivery when wet precipitation falls on frozen soils and cannot soak into the ground. Rather than infiltrate, rainfall can more easily generate runoff that carries manure and other contaminants toward receiving water bodies. It is estimated that, on average, nearly half of total phosphorus loading through Lake Mendota’s monitored stream tributaries occurs from January to March, making late winter and early spring one of our most vulnerable times for negative water quality impacts.
Water clarity
A warmer winter and above-normal rainfall in 2024 meant more runoff washing fertilizers, eroded soil, cow manure, leaf litter, and other sources of phosphorus into our lakes, resulting in comparatively lower clarity and more frequent algae blooms compared to the prior year.
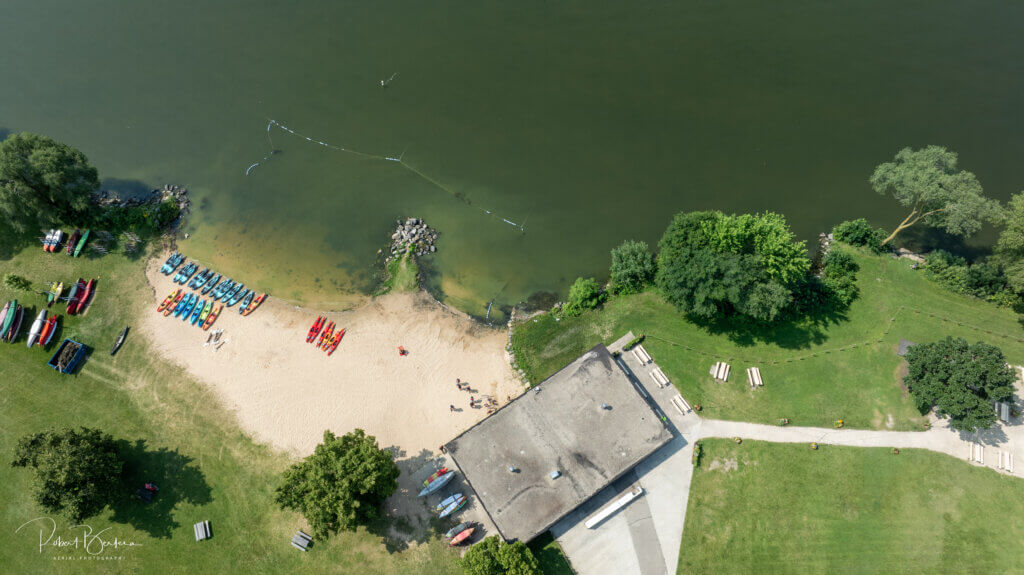
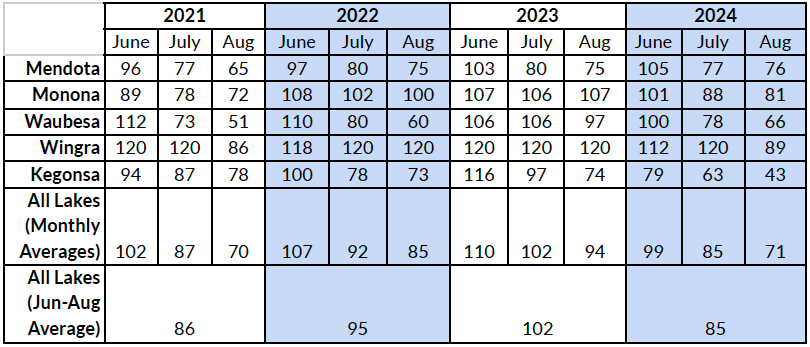
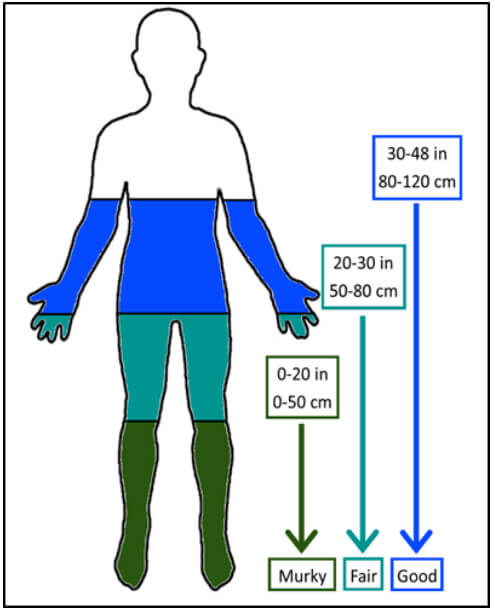
Table 2 below shows the average water clarity recorded on each lake from June 1st – August 31st. Average nearshore clarity for 2024 was comparatively lower than prior year averages, which were at an all-time high coming off a series of drought years. While clarity readings were lower than last year, lakes Mendota, Monona, Wingra, and Waubesa all reported results in the “good” water clarity range (Figure 3). The exception was Lake Kegonsa which fell in the “fair” water quality range.

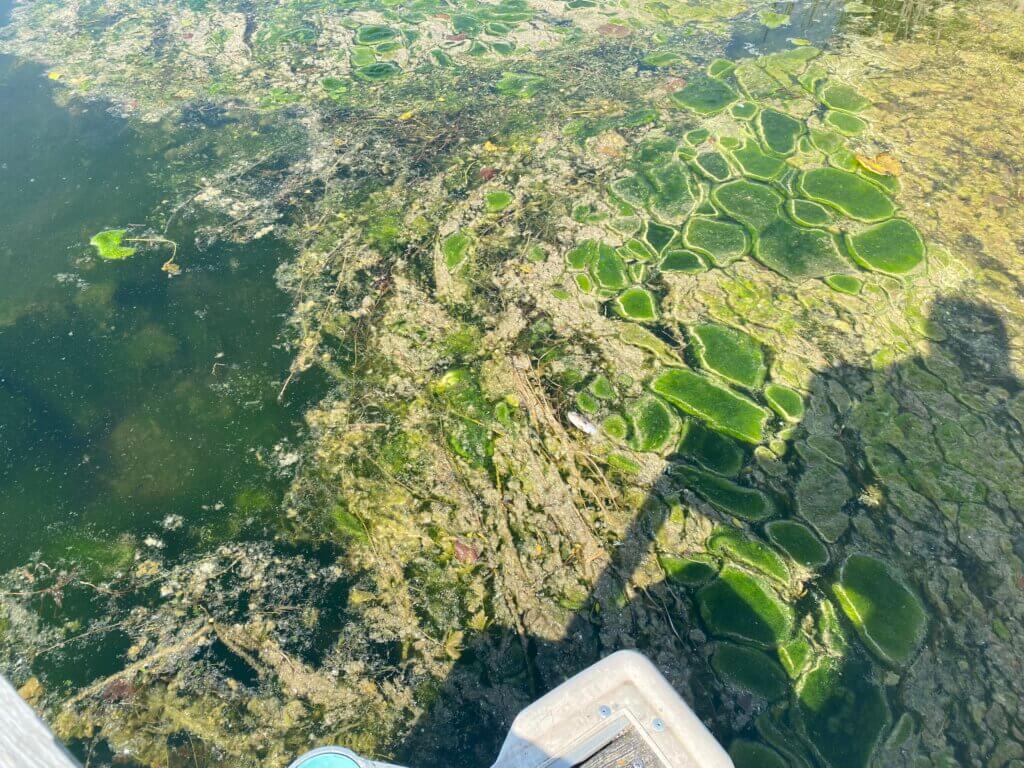
Cyanobacteria blooms
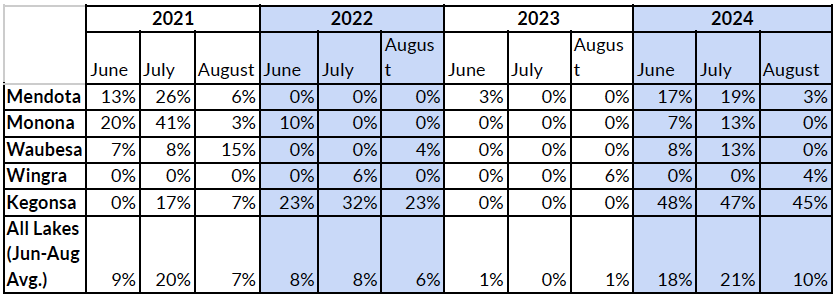
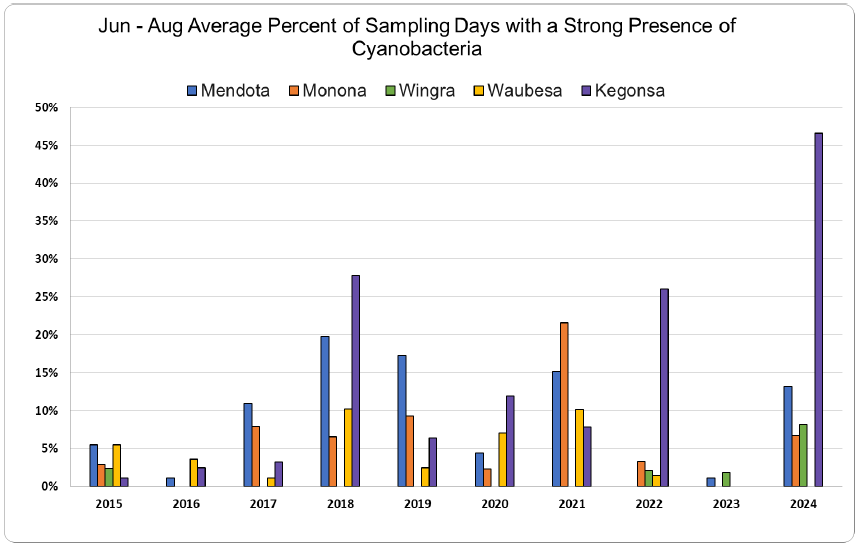
In reviewing this season’s bloom frequency, the same analytical method first adopted in 2018 was used. This approach counts the number of days on each lake with at least one report of a strong cyanobacteria bloom observed within the monitoring sites. By dividing the number of ‘cyanobacteria bloom days’ by the total number of sampling days for each lake, a percentage is generated representing how often the monitors observed at least one significant bloom (Table 3). A significant bloom means that the monitor observed strong evidence of a surface bloom covering at least half of their nearshore monitoring location. This method lessens overreporting in situations when different monitors report the same cyanobacteria bloom.
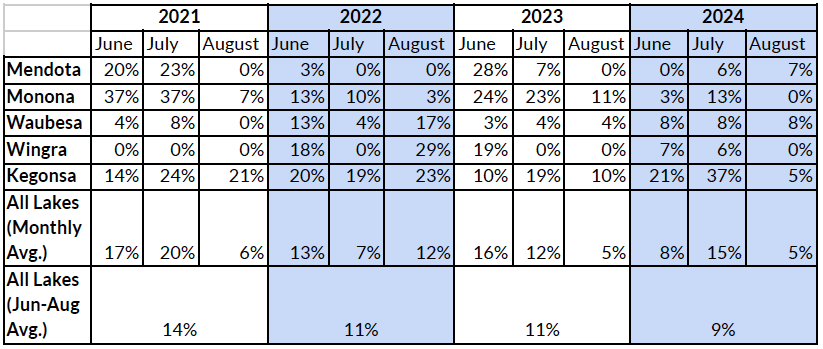
Cyanobacteria sightings
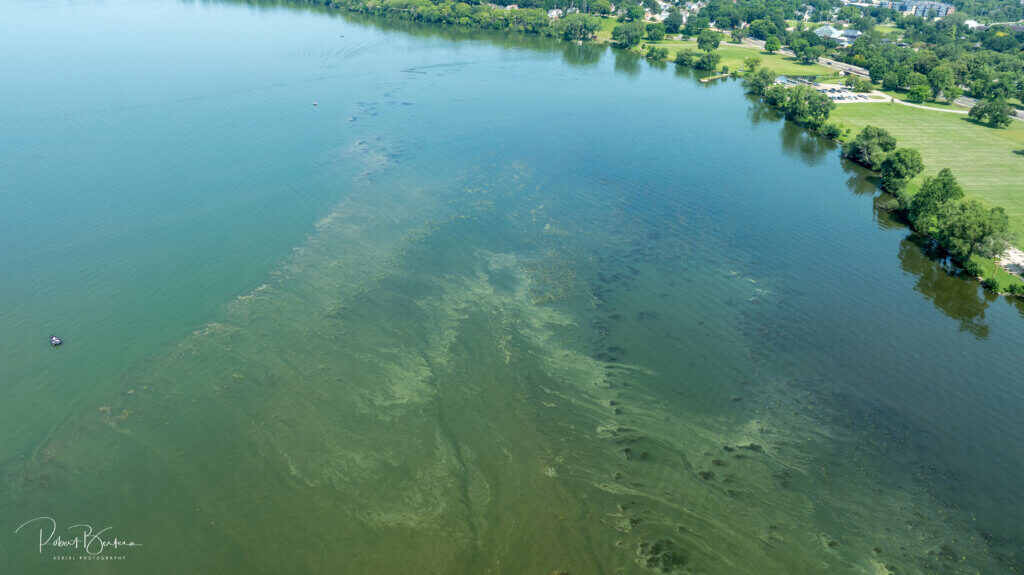
Overall, monitors reported significant cyanobacteria blooms during the 2024 sampling period. Lake Kegonsa and Lake Wingra monitors reported all-time high cyanobacteria sightings on their respective lakes resulting in the highest “All Lakes Average” we’ve had since the program began (Table 3). In particular, Lake Kegonsa monitors reported the presence of a strong cyanobacteria bloom on almost half of all sampling days. However, monitors on Lake Waubesa did not report a single significant bloom all summer. Both Mendota and Monona experienced increased cyanobacteria blooms this year, but thankfully, not as frequent as in previous years.
It’s worth noting that Lake Kegonsa monitors are the most active of any lake in the chain, averaging 29 condition reports per monitor in 2024. Lake Mendota monitors averaged 18 submissions/monitor, Lake Monona had 21 submissions/monitor, Lake Wingra 13 submissions/monitor, and Lake Waubesa had 14 submissions/monitor (Figure 5). Lake Kegonsa’s higher frequency of reporting, coupled with the fact that all but one of Lake Kegonsa’s monitoring locations are at private piers, likely means that few blooms go unnoticed.
Cyanobacteria forecasting and microcystin sampling
Since 2020, LakeForecast has partnered with Dr. Paul Block’s lab at UW-Madison to predict cyanobacteria bloom occurrences and the possibility of related beach closures for the upcoming monitoring season. Dr. Block’s team creates cyanobacteria forecasts for Lake Mendota using geospatial satellite imagery, global weather and ocean circulation patterns, and data collected from our monitors to predict the likelihood of cyanobacteria blooms in our lakes (Figure 6).
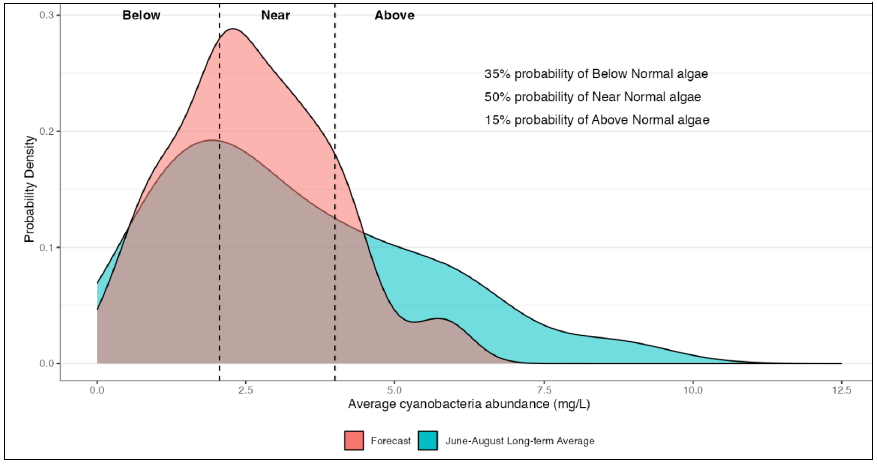
In early June, Dr. Block’s team released their prediction for June-August 2024. The modeling forecast “reflects strong likelihood of normal cyanobacteria biomass. This appears to be driven by the developing El Niño in the Pacific Ocean and slightly above-average rainfall and streamflow. El Niño conditions tend to shift forecast probability towards below normal, but the intense rain received at the end of May shifted our forecast quite a bit towards the near normal category. With that, the beach closure forecasts indicate that days closed will likely be near normal, and periods of beaches closed will be above normal.”
An updated forecast
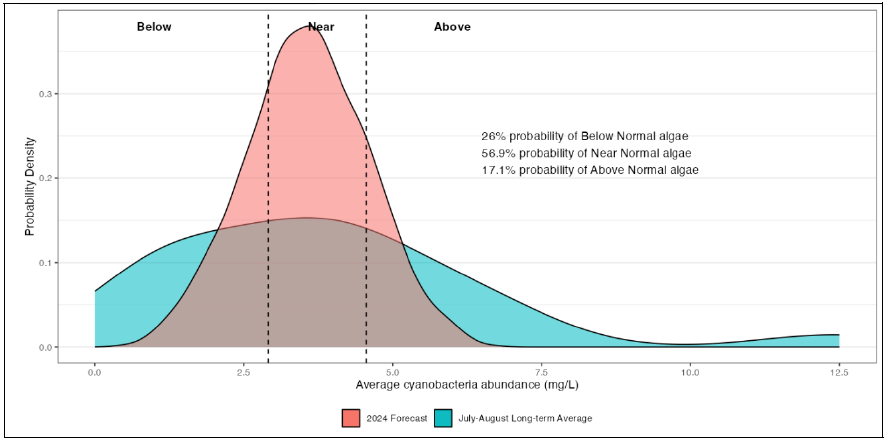
The abundant rainfall early this summer prompted Dr. Block’s team to release an updated prediction for July – August 2024. The newer forecast indicated a slightly increased likelihood of above-normal cyanobacteria blooms this summer but kept their prediction in the near-normal range (Figure 7).
Supplemental microcyctin testing
A select group of LakeForecast monitors provided supplemental microcystin testing for Dr. Block’s lab at four locations in 2024. Microcystins are a common class of toxins that can be produced by cyanobacteria, making them unsafe and potentially lethal to people, pets, and wildlife. As a reminder, cyanobacteria (commonly known as blue-green algae) is not an algae but a photosynthesizing bacteria naturally occurring in our waters. Only certain strains of cyanobacteria can produce microcystins, and species that can generate this toxin do not necessarily produce microcystins during each bloom. In addition, microcystin concentrations are not always correlated with the intensity of the bloom. Having a greater understanding of when cyanobacteria produce microcystins and at what concentration could aid public health officials in assessing toxicity risk.
Monitors performed microcystin sampling when blooms were and were not present at randomized collections. Four monitors began testing for microcystin concentrations in late July, continuing through early September. Of the 32 samples collected in 2024 across lakes Mendota, Monona, and Kegonsa, 53% of tests were positive for the presence of microcystins, a new record. Of the tests with positive microcystin results, nine samples (28%) had a microcystin concentration of 5 parts per billion (ppb) or higher. For reference, Public Health Madison & Dane County closes our beaches when concentrations reach 8 ppb or higher. Monitors participating in this sampling allow Dr. Block’s lab to ground-truth and supplement satellite data, therefore improving modeling capabilities and future cyanobacteria forecasts.
Green algae blooms
While this summer saw elevated cyanobacteria blooms, monitors reported more moderate frequencies of green algae blooms. These surface blooms, which do not produce toxins, are most often the product of filamentous algae accumulations that detach from the lake bottom.
2024 was a historically typical monitoring season in terms of reported green algae blooms (Table 4). Lakes Mendota and Monona experienced less significant green algae blooms than last year, whereas lakes Wingra, Waubesa, and Kegonsa had increased reports of blooms compared to the prior year (Figure 8).
The same analytical method to assess frequency of occurrence was used for green algae blooms as cyanobacteria blooms. This approach counts the number of days when one or more monitors reported “strong evidence” for a green algae bloom at their monitoring station. By dividing the number of ‘green algae bloom days’ by the total number of days each lake was monitored, a percentage is generated that better represents the number of blooms witnessed each year on a given lake (Table 4). This method lessens the chances of over-reporting that could result when different monitors might report the same algal bloom.
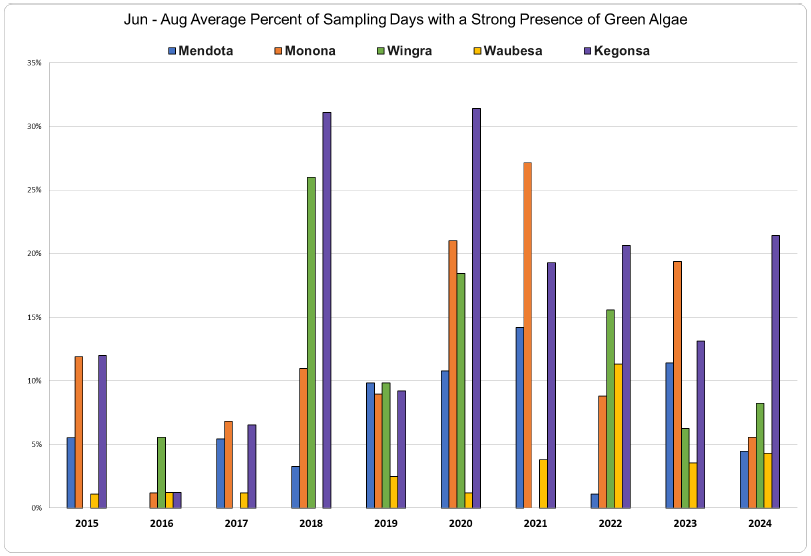
Increased algae with phosphorus runoff
Increased green algae production is common in fertile lakes with high nutrient concentrations, often caused by excessive phosphorus runoff. At moderate levels, green algae and native aquatic plants play an important role in maintaining healthy lake ecosystems. While green algae on its own is not harmful to human or animal health, it can become an unwelcome nuisance when it takes the form of large floating mats that wash up on shore and decompose.
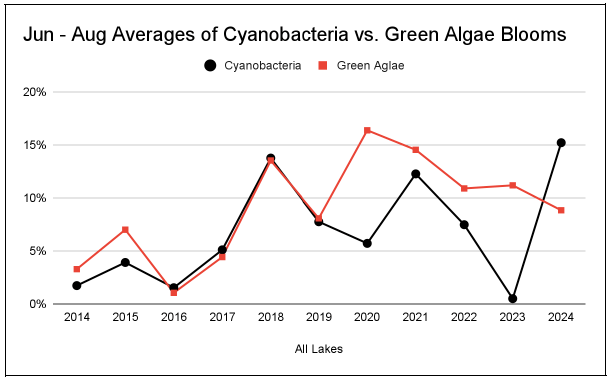
As shown in Figure 9, there has been a considerable difference in the type of blooms reported by monitors from year to year, with noticeably more green algae blooms relative to cyanobacteria starting in 2020. However, this is the first year since the LakeForecast program began when more cyanobacteria blooms were reported than green algae blooms. The significant disparity between bloom types from last year to this year highlights the dynamic and complex relationships between weather conditions, phosphorus loading, lake biology, and water quality responses.
Thank you, monitors!
Clean Lakes Alliance wishes to recognize the following volunteer LakeForecast monitors for their many contributions to the success of this program:
Lake Mendota
- Madelyn Anderson
- Rhonda Arries
- Lynn Ascione
- Amy Beczkiewicz
- Emily Conklin
- Ted Davenport
- Doris Dubielzig
- Jan Eddy
- Nancy Ellison
- Friends of UW Lakeshore Nature Preserve
- Robert Gilbert
- Emily Heald
- Paul Hendrickson
- Valerie Holewinski
- Andy Ippolito
- Jerry Jendrisak
- Sydney Kerstein
- Arlene & Jeff Koziol
- Jackie Lanear
- Jay Larson
- Peggy Lee
- Allan Levin
- Linda Malkin
- Seth McGee
- Carol Michalski
- Sam Minor
- Stephanie Ogborne
- AnnaBeth Thomas
- David Sliwicki
- Jacob Stampen
- Mattie Urrutia
- Ian Wegger
Monona
- Doug Bach
- Jill Ball
- Bob Bertera
- Carolyn Betz
- Brittingham Boats
- Tanner Davis
- Claire Finucane
- Amie Francisco
- Heather Francisco & Troop 8315
- Rachel Groman
- Joanne Kaminsky
- Renee Long
- Mel McCartney
- Grace McClusky
- Lily McLeish
- Paul Miller
- Mary Murrell
- Joy Newmann
- Lexie Ofe
- Bud Palac
- Jamie Palmer
- Zak Redding
- David Schroder
- Tom Smith
- Jan Van Vleck
- Amy Wencel
- Bob Wickem & Lisa Riehl
- Paul Zech
Lake Wingra - Steve Glass
- Lisa Grueneberg
- Jess Hankey
- Sally Lehner
- John Nicol
- Sylvia Ramirez
- Andrew Swenson
Lake Waubesa
- Kitty Brussock
- Kenzie Burns
- Sandra Docter
- Andy Graham
- Scott Hangartner
- Margaret & Tom Howell
- Ginny Kominiak & Tom Reuschlein
- Tam Knickmeier
- John McIntyre
- Travis Olson
- Adele Sink
- Lori Wallman
Lake Kegonsa - Sarah Balz
- Bill & Amanda Blank
- John Bottorff
- George Corrigan
- Diane Farsette
- Connie Hagen
- Janice Kellogg
- Mike Krueger
- Deb Kundert
- Ken LePine
- Anne Meisner
- Claudia & Greg Quam
- Gary Tapper
- Peg Stine & Carl Johnson
- Kim Van Brocklin
- Kim & Tom Walz
- Jim Wilcox