2017 results from our monitoring program
Overview
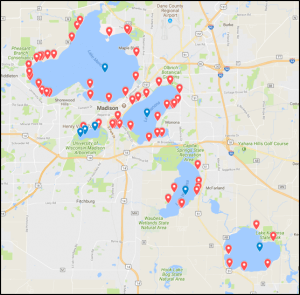
Figure 1. 2017 monitoring sites (Red: Near-shore; Blue: Off-shore).
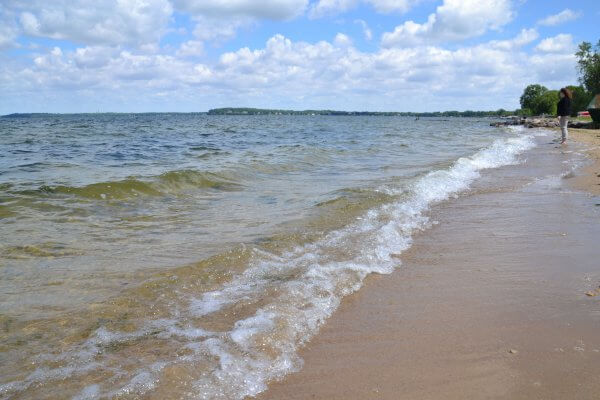
From Memorial Day to Labor Day, volunteers at piers and beaches around the five Yahara lakes measured near-shore water clarity, air and water temperature, and noted several visual observations.
Visual observations included presence of algal blooms (green/blue-green), floating plant debris, swimmers, waterfowl, wave intensity, and general water appearance.
Volunteers were asked to log condition reports at least weekly on our website, lakeforecast.org, where all data are updated in real time.
Highlights
- 62 near-shore and 7 offshore monitoring stations, covering all five Yahara lakes (Figure 1)
Table 1. Program growth over time. Category 2013 2014 2015 2016 2017 Monitoring Stations 10 46 58 79 69 Volunteers 9 43 57 68 73 Volunteer Hours 224 446 463 610 550 Condition Reports 204 945 1,258 1,720 1,989 - Weekly off-shore measurement of Secchi depth on all five lakes
- Measured temperature and dissolved oxygen profiles on all five lakes (seven sites total)
- Weekly monitoring continued at all 25 public beaches
- 15% increase in number of condition reports from 2016 (Table 1)
- Collected continuous near-shore temperature measurements at 14 sites on lakes Mendota, Monona, and Waubesa
- Increased frequency of near-shore monitoring to twice per week
- New spin on weekly Weekend Lake Reports with over 59,000 views on social media
- 358,000 people reached through web and broadcast stories about lakeforecast.org
Clarity and Algal Bloom Observations
Climate SummaryMadison experienced another mild winter in 2016-2017; lake Mendota froze for 65 days, only three days longer than the previous winter. For comparison, the average freeze length over the last 150 years is 101.2 days. Additionally, we experienced an overall wet monitoring season in 2017. We observed greater than average rainfall during the spring and early summer. Both June and July had precipitation totals over two inches greater than the historic averages. |
Compared to 2016, citizen monitors reported more blue-green algal blooms on lakes Mendota, Monona, and Kegonsa (Figure 2). In particular, monitors on lake Monona reported more blue-green algae blooms than both 2015 and 2016 combined. In contrast, monitors on both lakes Wingra and Waubesa identified fewer blue-green algal blooms.
Average clarity increased from 2016 on Waubesa and Kegonsa. The seasonal trend of higher clarity in May and June and lower clarity in July and August is expected and remained consistent with previous years by lake and site (Figure 3).
This pattern is a result of the annual spring clearwater phase during which algae consuming phytoplankton are at their maximum populations.
Furthermore, samples on Lake Wingra yielded lower than average clarity over all months, perhaps due to a rebounding carp population and/or localized urban stormwater inputs. Figure 4 helps visualize how turbidity readings collected by our monitors translate into general water clarity conditions.
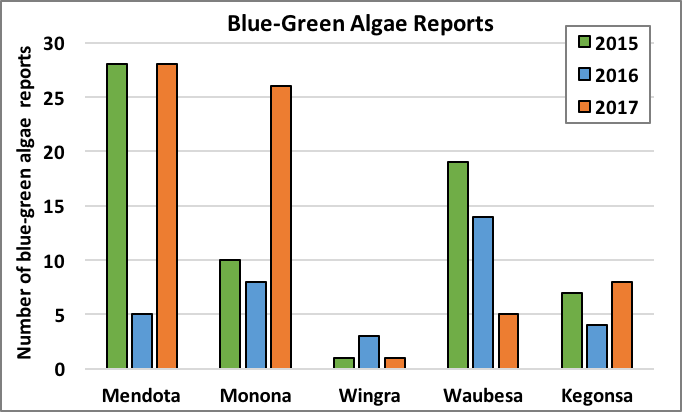
Figure 2. Number of reported blue-green algae blooms by lake over
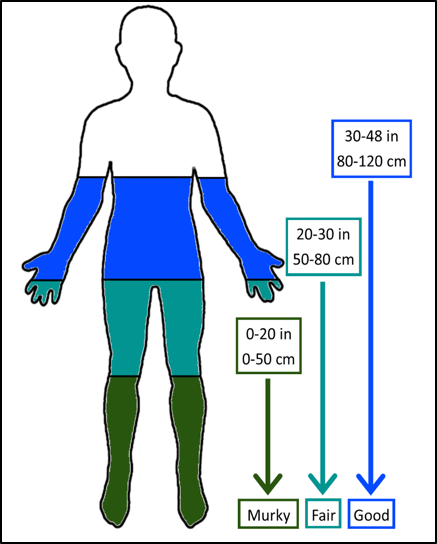
Figure 4. At what depths can you see your toes? We created this human representation to help visualize water clarity.
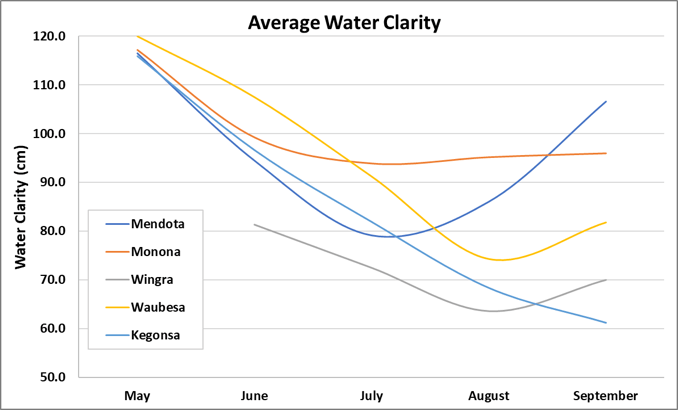
Figure 3. average clarity by month for each lake.
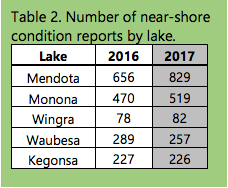 For this reason, the same baseline will likely take longer to establish on lakes Waubesa, Kegonsa, and Wingra. While frequency of sampling is important, the quality of measurements is equally imperative. Correct identification of algal blooms and precise clarity measurements are the foundation of the citizen monitoring data set.The number of condition reports increased on lakes Mendota and Monona (Table 2).
The continued increase in condition reports will help establish a baseline to compare subsequent monitoring seasons. A larger sample size is necessary to minimize the effects of random variability in nearshore water quality measurements.
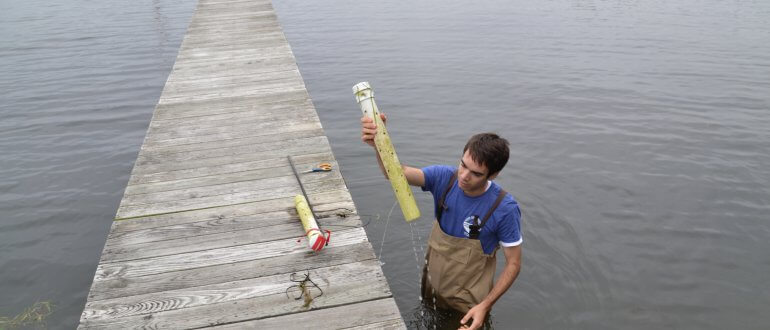
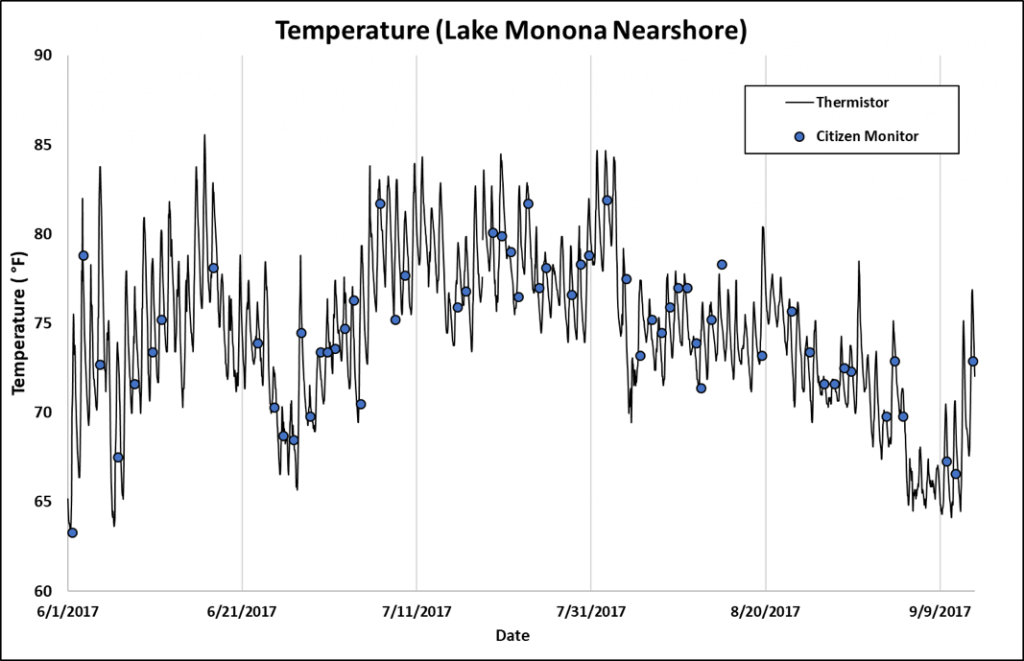
Thermistor Data
Hourly water temperature readings highlight the variability in the nearshore environment (Figure 5). The manual temperature readings collected by monitors help ground-truth the thermistor’s data, ensuring that automated collections are accurate and reliable. Since blue-green algae thrive in warmer water, it is important to know how temperature varies in both time and space across the lakes. The use of thermistors to supplement volunteer monitoring drastically increases sample size and improves the potential for lake condition forecasting.
Interpretation of Observed Conditions
In general, nearshore water clarity returned to similar levels seen in 2015 which suggests that clarity declined from last year. Precipitation records indicate that 2017 was another unusually wet year, with much of the increase in precipitation coming from small rain events less than 0.5 inches. Since rainfall is one of the primary mechanisms for delivering phosphorus to the lakes, we would expect an increase in algae reports and lower than average clarity after a rainy spring and early summer.
Additionally, the increase in smaller storm events means the ground remained saturated longer, potentially increasing runoff. In general, we did experience an increase in blue-green algae reports and slight decrease in clarity on lakes Mendota and Monona. However, precipitation patterns alone are insufficient to explain condition reports seen throughout the spring and summer. Additionally, there was no bias toward sampling before or after rainfall events, and the percentage of condition reports taken after rainfall was consistent with previous years.
While precipitation patterns and winter temperatures were similar to the 2016 season, our results for 2017 are significantly different. This fact exemplifies the idea that water quality is a dynamic condition that is difficult to analyze on a yearly basis. Long term climate trends, the unknown impacts of invasive species, and random spatial variability make it difficult to identify whole-lake patterns of water quality.
Blue-Green Algal Bloom
On June 16, the Madison lakes experienced one of the largest blue-green algae blooms seen in many years (Figure 6). Phosphorous laden runoff generated by above average rainfall reached lake Mendota. Combined with warm temperatures and minimal wind, the conditions were perfect for blue-green algae to reproduce and bloom into surface scums.
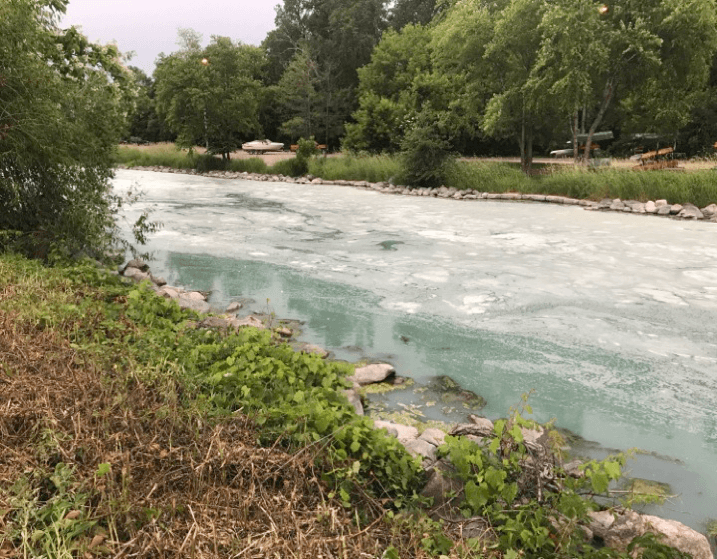
Figure 6. Blue-green algae fills the Yahara River between lakes Mendota and Monona.
While not always toxic, many species of blue-green algae have the potential to produce toxins that can harm local wildlife and lake users. This specific bloom was particularly devastating, killing fish and even other types of wildlife, such as crayfish and ducks. In a laboratory setting it is comparatively straightforward to understand and provide the conditions algae need to reproduce.
However, it is much more difficult to predict the formation and size of algal blooms in a dynamic lake environment. The June 16 algal bloom illustrates the importance of the data collected by our citizen monitors. Understanding the conditions that generate such massive and damaging blooms and knowing when they are occurring will helpus better inform and protect the public.
Support Water Quality Monitoring
Our water quality monitoring program is meant to keep the public informed so that you and your families have a safe and fun beach experience! We rely on donations from beach-goers and residents so that monitors can provide these services.
Become a Lake Forecasting Steward today by donating $135 to cover the fixed cost needed to supply one or more volunteers with monitoring equipment. This program allows Clean Lakes Alliance to inform the public of the latest water quality conditions at more than 70 monitoring sites across lakes Mendota, Monona, Wingra, Waubesa and Kegonsa. You can donate now at: cleanlakesalliance.org/product/lake-forecasting-steward.