LakeForecast water quality monitoring in 2021
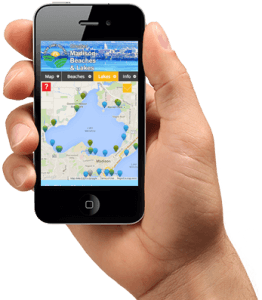
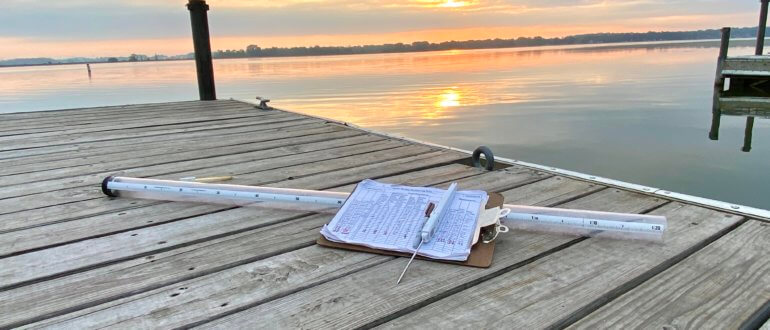
In 2021, our volunteers embarked on the 9th season of LakeForecast water quality monitoring. This work involved collecting nearshore condition reports at piers, beaches, parks, and access points around the five Yahara lakes. From May through September, volunteers took water quality measurements. They measured water clarity, recorded air and water temperature, identified the presence of green algae and cyanobacteria, and noted additional visual observations. Reports are entered into the LakeForecast app where all data are updated in real time.
This initiative would not be possible if it were not for the dedication of all our volunteers. Volunteer efforts better inform the community about changing water quality conditions while improving our understanding of evolving lake dynamics. Their work also helps share important public health information with the greater community.
Highlights
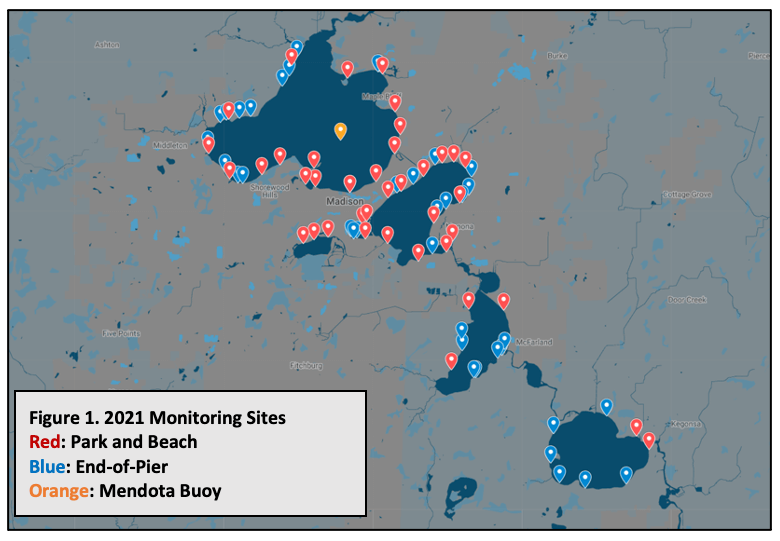
- 77 nearshore monitoring stations covering all five Yahara lakes (Figure 1)
- All 25 public beaches monitored at least twice a week
- Offshore sampling on all five lakes, seven locations in total
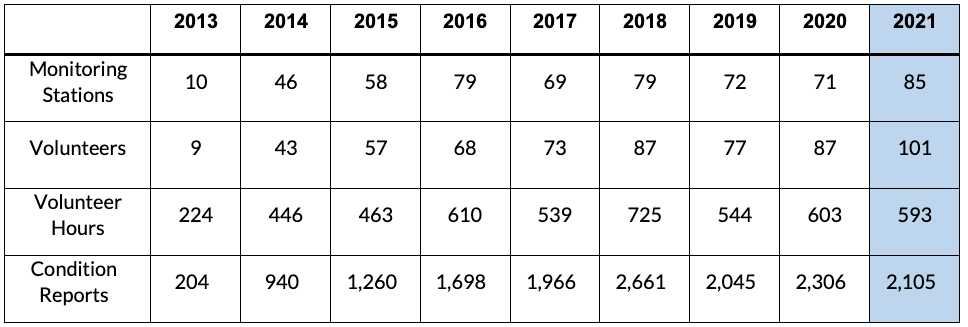
- New program record of 101 volunteers
- Algal toxin (microcystin) testing at six beaches in partnership with UW-Engineering’s Water Systems and Society Research Group
- Recruited 37 new volunteers
- Partnered with BloomOptix to pilot rapid cyanobacteria detection using digital microscopes
- New monitoring sites established at Wyldhaven Park and six end-of-pier residences
- Performed year-end compilation and quality control on all past data since 2014, representing a dataset comprising 1,459 unique reports
Rainfall
If the amount of streamflow was the same every year, it is estimated that phosphorus inputs to Lake Mendota would have decreased by about 36% over the last 30 years. This indicates that land management practices are effective. However, wet weather and more runoff can more than offset the benefits of those practices. (Source: Water quality fundamentals, Yahara CLEAN Compact)
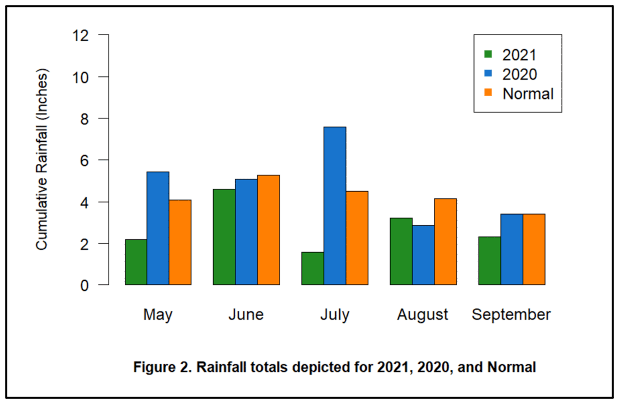
Rainfall totals for 2021 (shown as green bars in Figure 2) demonstrated a deviation from more recent trends of increased rainfall volume. Based on weather gauge data from the Dane County Airport, the greater Madison area experienced a notably dry season compared to 2020. July was a particularly dry month with only 1.58 inches of rainfall. August was the only month slightly wetter than the prior year’s monthly total. None of the monthly totals exceeded the monthly normal (average rainfall from 1991-2020).
While rainfall is the primary driver of the runoff that delivers phosphorus to our lakes, there are many other variables that affect water clarity and algal growth. Temperature, legacy phosphorus (long-term accumulation of phosphorus, often in stream and lake sediment), internal phosphorus cycling (accumulated sediment bound phosphorus released back into the water column), aquatic invasive species impacts, and wind-driven mixing are just some of the many variables that create dynamic lake ecosystems.
Lake Ice
The winter leading into the 2021 summer monitoring season was relatively warm. Lake Mendota froze for 77 days, only seven days longer that the previous year when it froze for 70 days. For reference, the median duration of ice cover on Lake Mendota is 104 days measured over the last 165 seasons. A shorter winter leads to warmer temperatures earlier in the year, effectively creating a longer growing season for algae and aquatic plant life.
Algal Blooms
In documenting cyanobacteria blooms, we continued to use the same method first utilized in 2018. This approach tallies for each lake the number of days when one or more strong* cyanobacteria blooms are reported. By comparing the number of ‘algal days’ to the total number of unique sampling days for each lake, we can generate a percentage that better represents the number of blooms witnessed each year (Figure 3). For example, in 2021 Lake Monona volunteers reported strong evidence of cyanobacteria on 15.2% of all monitored days. This method eliminates over reporting in situations when different monitors report the same algal bloom.
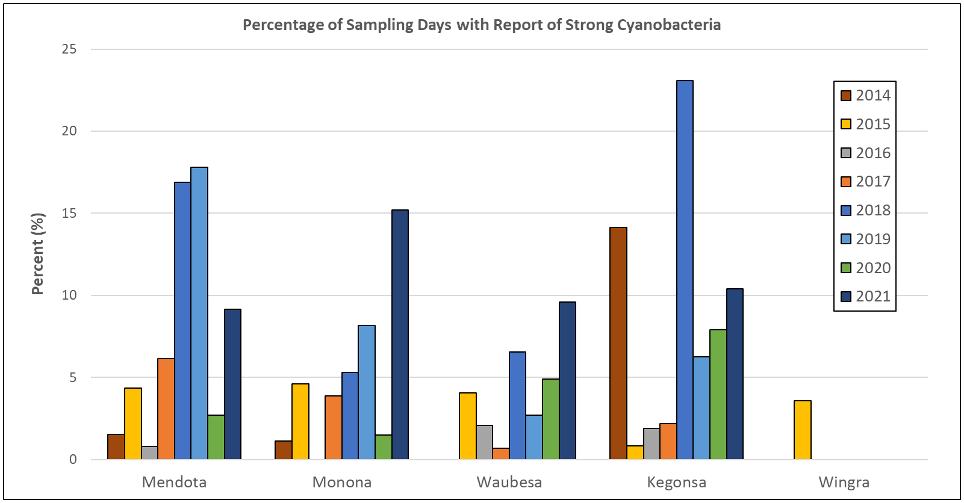
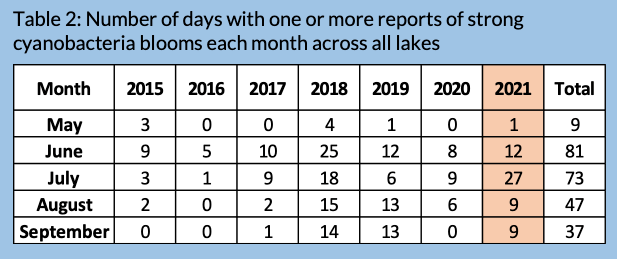
Compared to 2020, monitors documented more “strong evidence” of cyanobacteria blooms on the four primary lakes. Monona and Waubesa volunteers identified more days with strong cyanobacteria blooms than they did in the previous six years. Lake Wingra remained consistent with no reports of strong cyanobacteria blooms. Figure 3 highlights the significant variability in algal days across each lake. Generally, the highest number of strong cyanobacteria blooms are reported in June and July, followed by a sharp decline in August (Table 2). May and September often have fewer strong reports of cyanobacteria as fewer monitors are active. In addition, the typically cooler weather conditions do not support the rapid algal growth we see in the warmer summer months.
Clarity
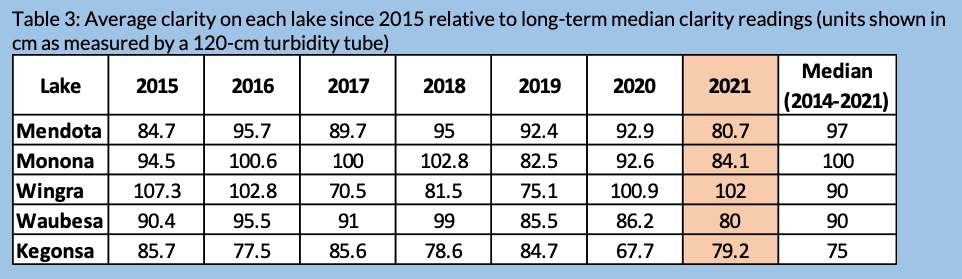
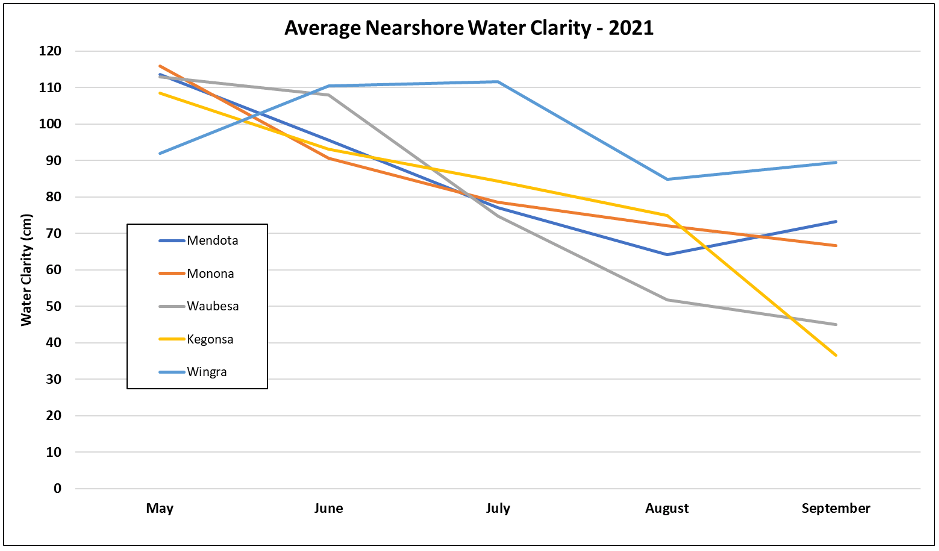
Table 3 shows average clarity calculated from May 1 to September 30, 2021, relative to the median clarity for all years. Clarity reports did not reveal any consistent trends across all lakes when compared to 2020. Lake Kegonsa and Lake Wingra demonstrated an improvement in water clarity. However, Mendota, Monona, and Waubesa saw moderate reductions in clarity when compared to the previous year. These observations also hold true when compared to the long-term median water clarity measurement for each lake. With the exception of Lake Wingra, overall water clarity in 2021 for the Yahara lakes was relatively poor when compared to previous years.
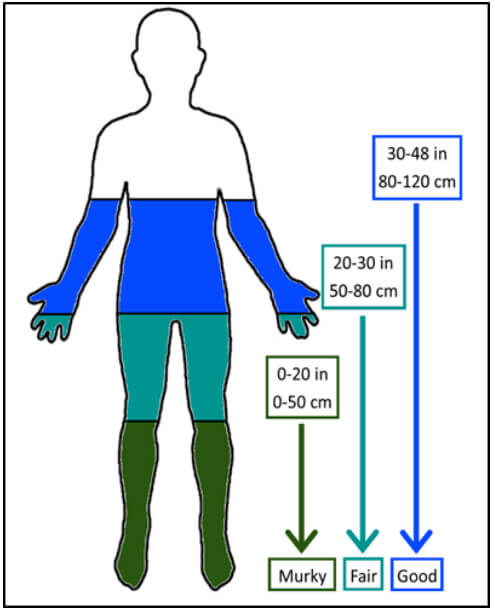
As depicted in Figure 4, average clarity for most lakes decreased throughout the summer with a peak decline in August. Lake Kegonsa deviated from this trend as clarity readings were at a season low in September: 36.6 cm, classified as “murky” (Figure 5). The shallower depths of Lake Kegonsa combined with its low-elevation position within the watershed and chain of lakes likely contributed to the lower clarity readings.
Identifying whole-lake trends
Observations from the 2021 monitoring season demonstrate the difficulty in identifying whole-lake trends in water clarity and algal presence. Despite an unusually dry year, water quality conditions were generally poor when compared to historical LakeForecast data. This highlights the fact that the complex interactions of multiple variables affect water quality. There can also be long lag times between watershed actions that reduce phosphorus and lake response. The data collected by LakeForecast volunteers offer a valuable tool to help us better understand cause-and-effect relationships as they apply to ever-changing lake conditions.
Additional resources
Please see Fundamental Concepts on Water Quality of the Yahara Chain of Lakes (Mendota, Monona, Wingra, Waubesa, and Kegonsa). It contains an excellent summary of our current understanding of lake dynamics.