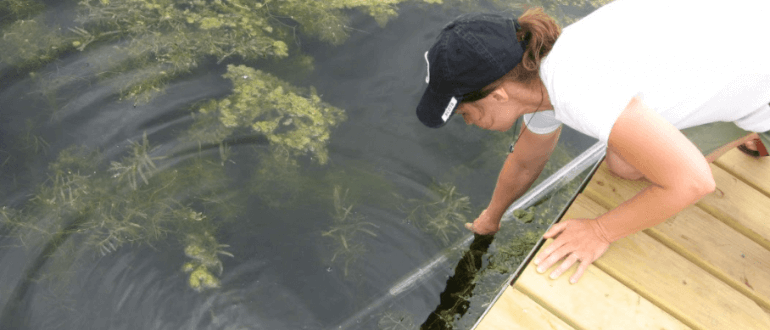
In 2020 water quality monitoring took place at piers and beaches around the five Yahara lakes. Volunteers measured near-shore water clarity, air and water temperature, and noted several visual observations during the monitoring season, which runs from May to September.
2020 water quality monitoring overview
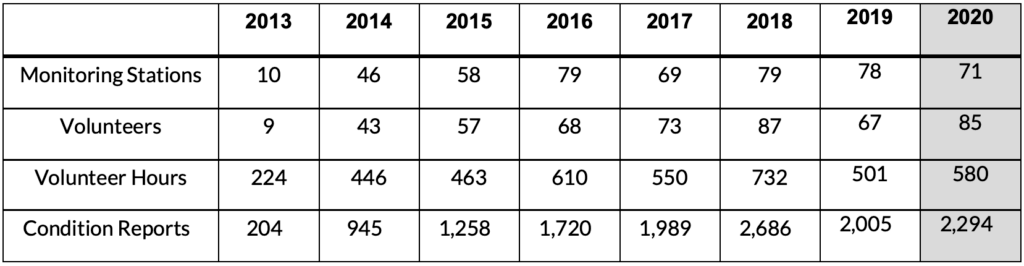
Despite the challenges of a global public health crisis, our network of dedicated volunteers are commended for coming together for another successful year of lake monitoring. Interest in the program remains high, and we recruited another 24 first-time volunteers to join our growing ranks.
Due to operational constraints related to COVID-19, both the thermistor temperature collection and offshore data sampling were suspended for the season. While the resulting data gaps are unfortunate, we are grateful for the hard work and support of our nearshore lake monitors who helped us further the goals and objectives of LakeForecast.
We also grieved the loss of two long-time lake monitors, Bill Lamm and Roger Bannerman. Both remarkable individuals were critical to the advancement of lake science and served as strong advocates for our lakes. We will miss them both dearly.
2020 water quality monitoring highlights
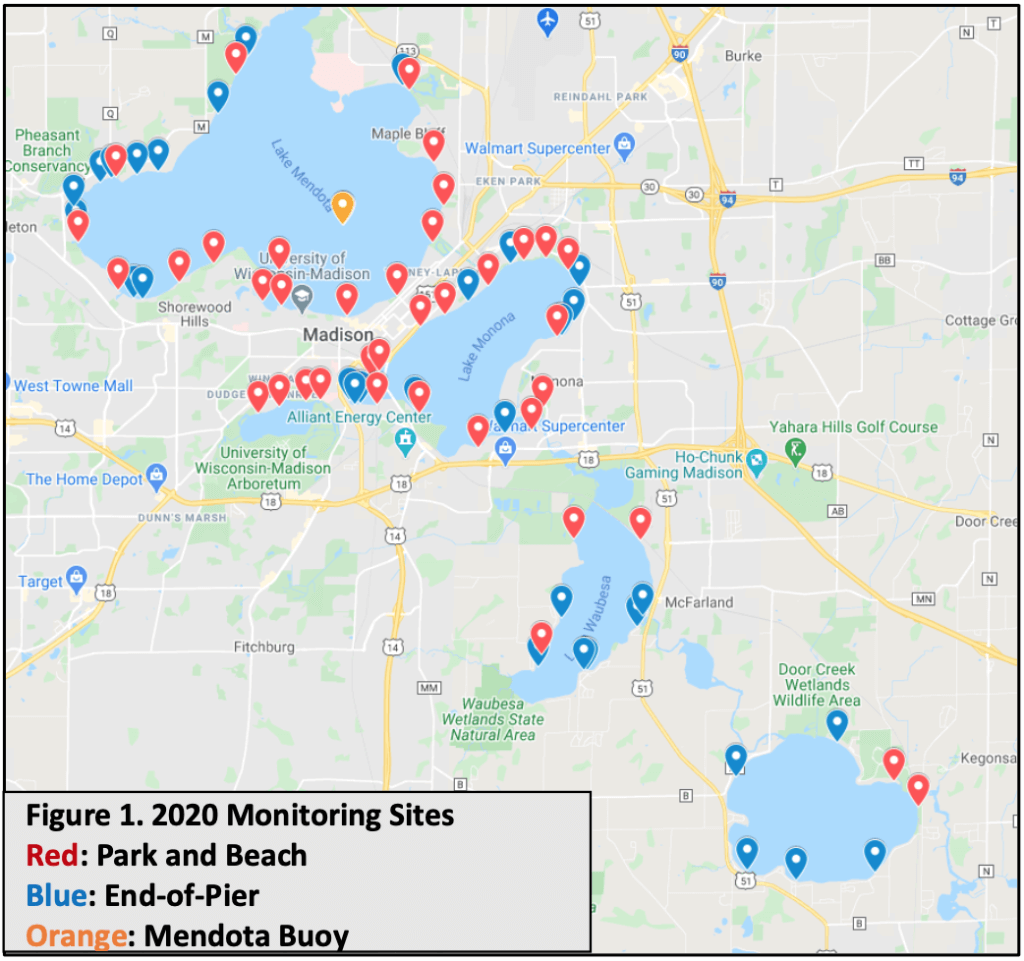
- 71 near-shore monitoring stations reported conditions on all five Yahara lakes (Figure 1)
- All 25 public beaches monitored at least twice a week
- Recruited 24 new volunteer monitors to improve reporting frequency at public beaches
- Performed algal toxin (microcystin) testing at 6 public beaches in partnership with UW- Engineering
- LakeForecast featured weekly on Channel 3000 in new partnership to report water quality conditions on local television
- Implemented new LakeForecst picture submission feature
- Launched LakeForeacst in the iOS and Android app stores
- New monitoring sites established at Camp Randall Rowing Club and Paunack (A.O.) Park
Rainfall
Rainfall is the driving force that connects our landscapes with the lakes. Over the last 30 years, the average annual phosphorus input into Lake Mendota was about 76,000 pounds and ranged from about 23,000 pounds in 2003 to 171,000 pounds in 2019. This wide range is mainly caused by large variations among years in rainfall, snowmelt, and resulting stream flow.
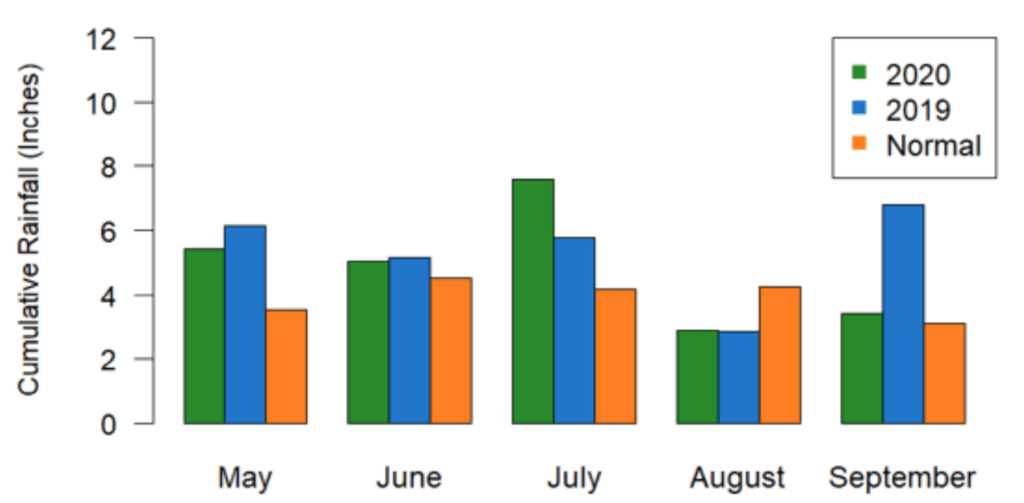
Rainfall totals for 2020 provided a familiar snapshot of the upward trend in increased rainfall volume that is challenging our lakes and infrastructure. Based on gauge data from the Dane County Regional Airport, the Greater Madison area experienced a similar total amount of precipitation in the summer of 2020 compared to the summer of 2019 (Figure 2). July was a particularly wet month reaching a total of 7.59 inches, while things slowed down in September which measured close to normal. All months except August exceeded the normal (average from 1981-2010) rainfall amounts.
Lake ice
The winter preceding the monitoring season (2019-2020) was generally warmer with Lake Mendota freezing for 70 days in comparison to the winter of 2017-2018 when it froze for 86 days. For reference, the median duration of ice on Lake Mendota is 104 days measured over the last 165 seasons. A shorter winter leads to warmer lake temperatures earlier in the year, effectively creating a longer growing season for algae and aquatic plant life.
Algal blooms
When documenting cyanobacteria reports, we continued to use the same method utilized in 2018. Instead of a simple count of all reports, the number of days when one or more strong* cyanobacteria bloom was summarized for each lake. By comparing the number of ‘algal days’ to the total number of unique sampling days for each lake, we can generate a percentage that better represents the number of blooms witnessed each year (Figure 3). This method eliminates over reporting in situations when different monitors report the same algal bloom.
*A “strong” cyanobacteria bloom is defined as surface accumulation covering the majority of the sampling site.
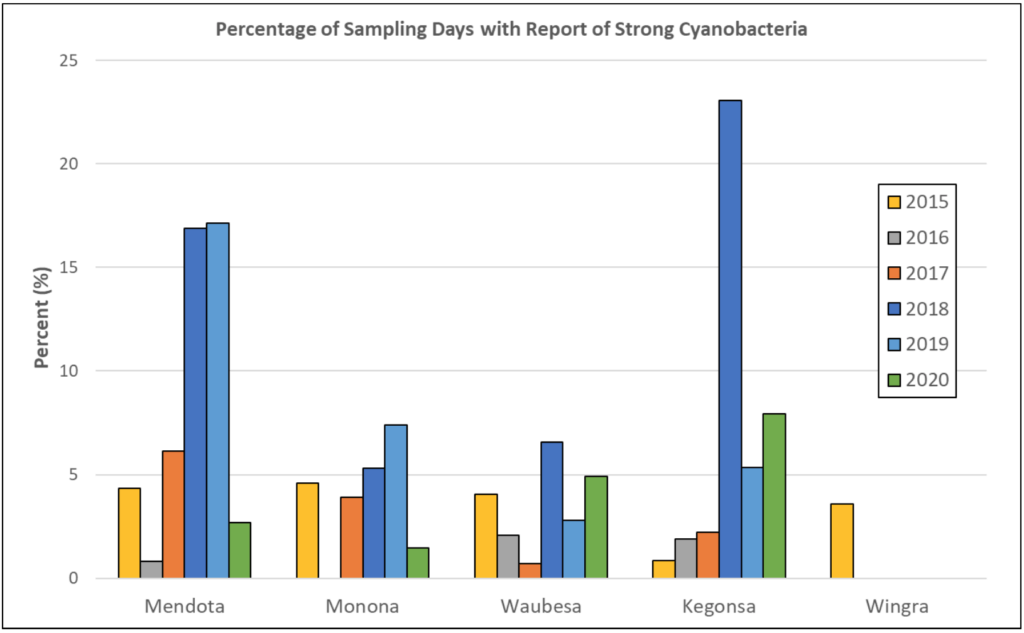
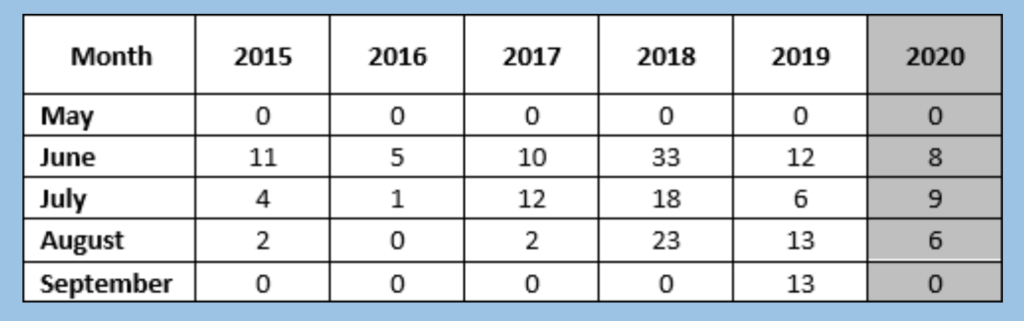
Compared to 2019, monitors documented more “strong evidence” of cyanobacteria blooms on Waubesa and Kegonsa. In contrast, lakes Mendota and Monona experienced notable declines in reports. Lake Wingra remained consistent with no reports of “strong” cyanobacteria blooms. Figure 3 highlights the significant variability in reporting across each lake. Cyanobacteria blooms were reported fairly consistently from June-August (Table 2). May and September often have no strong reports of cyanobacteria as only a few monitors are active, and the weather conditions do not support the rapid algal growth we see in the warmer summer months.
Clarity
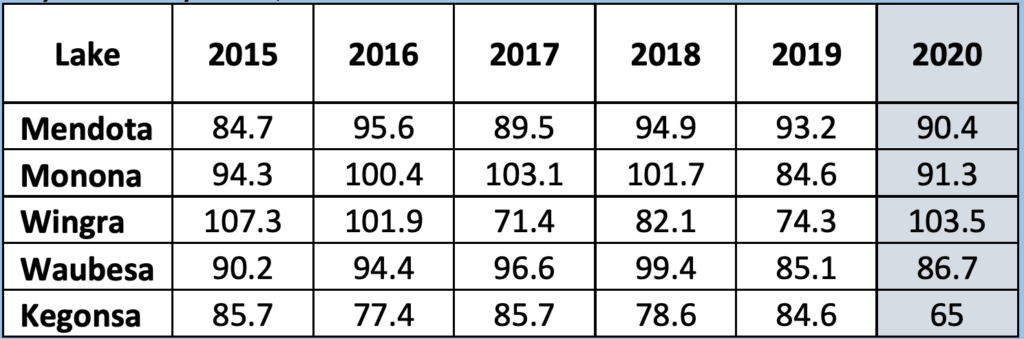
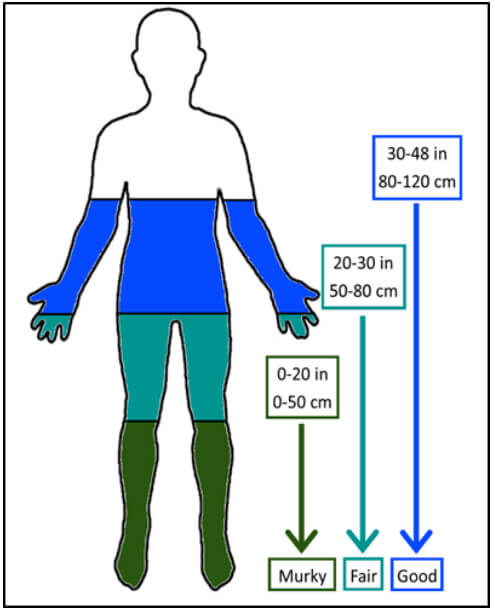
Table 3 shows average clarity weighted and calculated from May 1 to September 30, 2020. Clarity reports did not reveal any consistent trends across each lake when compared to 2019. Lake Monona and Lake Wingra demonstrated a marked improvement in water clarity, while Mendota and Waubesa displayed similar results to 2019. Only Lake Kegonsa reported a decline in water clarity with average clarity for August and September coming in at 33.9 cm and 39 cm, respectively (considered “murky”) (Figure 4).
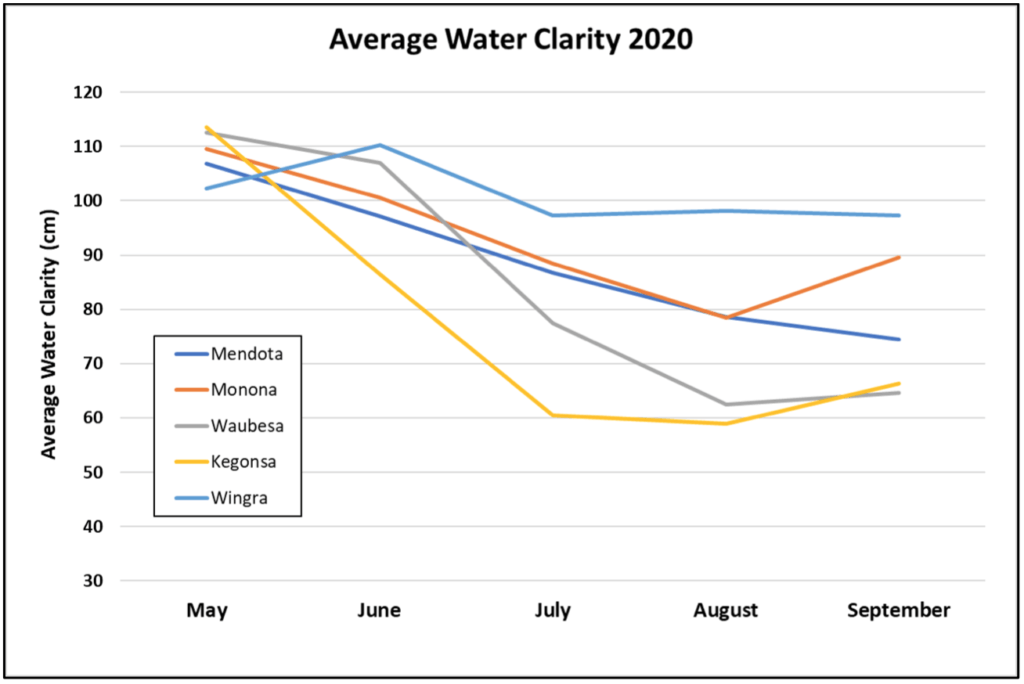
The high rainfall total measured in July may have had lasting, negative impacts on water clarity as the season progressed. As depicted in Figure 5, average clarity decreased throughout the summer with a peak decline in August. This phenomenon was consistent across each lake and is somewhat typical as algal activity increases as temperatures rise.
Additional resources
Download the entire 2020 Yahara Lakes Water Quality Monitoring Report.