Overview
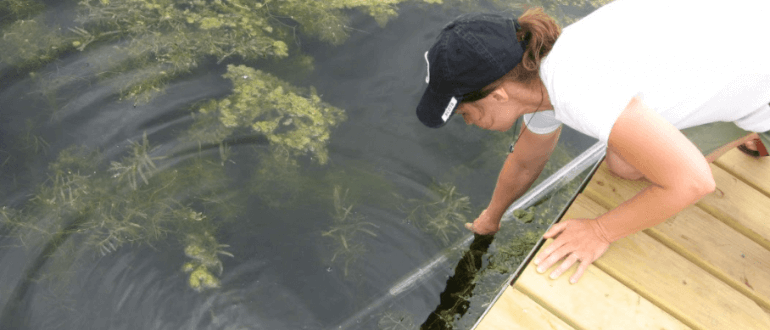
In 2019 water quality monitoring took place at piers and beaches around the five Yahara lakes. Volunteers measured near-shore water clarity, air and water temperature, and noted several visual observations during the monitoring season, which runs from May to September.
Visual observations included presence of algal blooms (green/cyanobacteria), floating plant debris, swimmers, waterfowl, wave intensity, and general water appearance. Volunteers were asked to log condition reports at a twice weekly minimum on our website, LakeForecast.org, where all data are updated in real time.
2019 water quality monitoring highlights
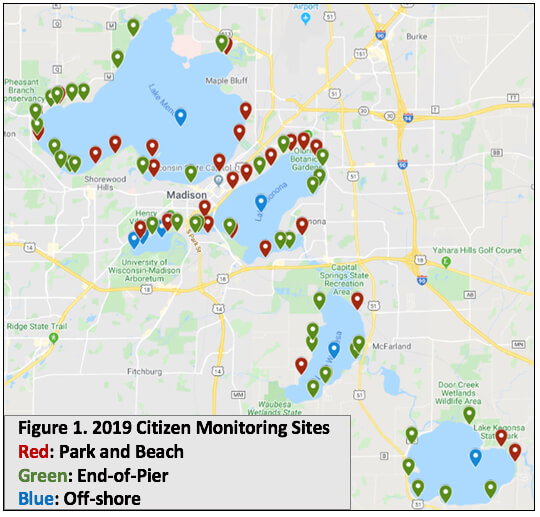
- 71 near-shore and 7 offshore monitoring stations on all five Yahara lakes (Figure 1).
- Weekly off-shore measurement of Secchi depth on all five lakes.
- Measured temperature and dissolved oxygen profiles on all five lakes (seven sites total).
- All 25 public beaches were monitored twice a week.
- Collected continuous near-shore temperature measurements at 15 sites on lakes Mendota, Monona, Waubesa, and Kegonsa.
- Continued microcystin testing at James Madison Park, in partnership with UW-Engineering.
- Continued weekly Weekend Lake Reports with more than 61,100 views on social media.
Rainfall
The 7 highest yearly rainfall totals on record occurred in the last 15 years. (Source: Dane County Regional Airport)
The last two years exhibited rainfall patterns that exceeded the Normal (average from 1981-2010). This is consistent with recent trends of greater rainfall frequency and intensity.
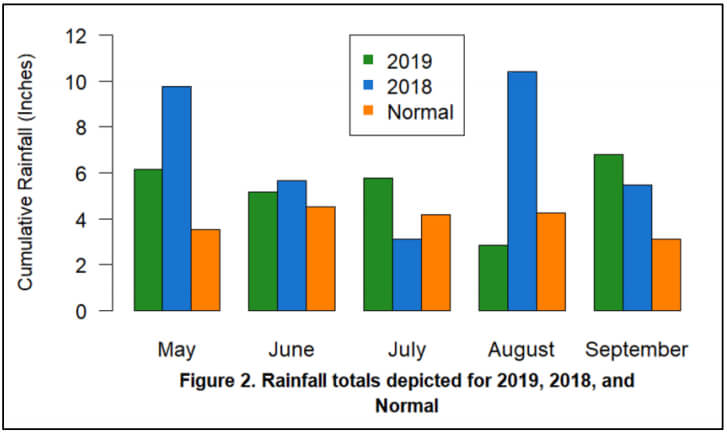
Based on gauge data from the Dane County Airport, the Greater Madison area experienced a lower total amount of precipitation in the summer of 2019 compared to the summer of 2018 (Figure 2). The decrease in rainfall occurred mostly in late spring and late summer. Only the months of July and September experienced greater accumulation than 2018. August 2019 recorded 2.85 inches of total precipitation. This was in stark contrast to the 10.40″ observed in August 2018, and certainly a reflection of the historic flooding events Madison endured in the summer of 2018.
Lake Ice
The winter preceding the monitoring season (2018-2019) was slightly warmer with Lake Mendota freezing for 86 days in comparison to the winter of 2017-2018 with Lake Mendota freezing for 94 days. Additionally, both Lake Mendota and Lake Monona opened for approximately two and a half weeks starting in December of 2018 while neither lake opened throughout the winter of 2017-2018. Ice conditions are an excellent indicator of winter severity.
Algal Blooms
When documenting cyanobacteria reports, we continued to use the same method utilized in 2018. Instead of a simple count of all reports, the number of days when a strong cyanobacteria bloom was summarized for each lake. By comparing the number of ‘algal days’ to the total number of unique sampling days for each lake, we can generate a percentage that better represents the number of blooms witnessed each year (Figure 3). This method eliminates over reporting in situations when different monitors report the same algal bloom.
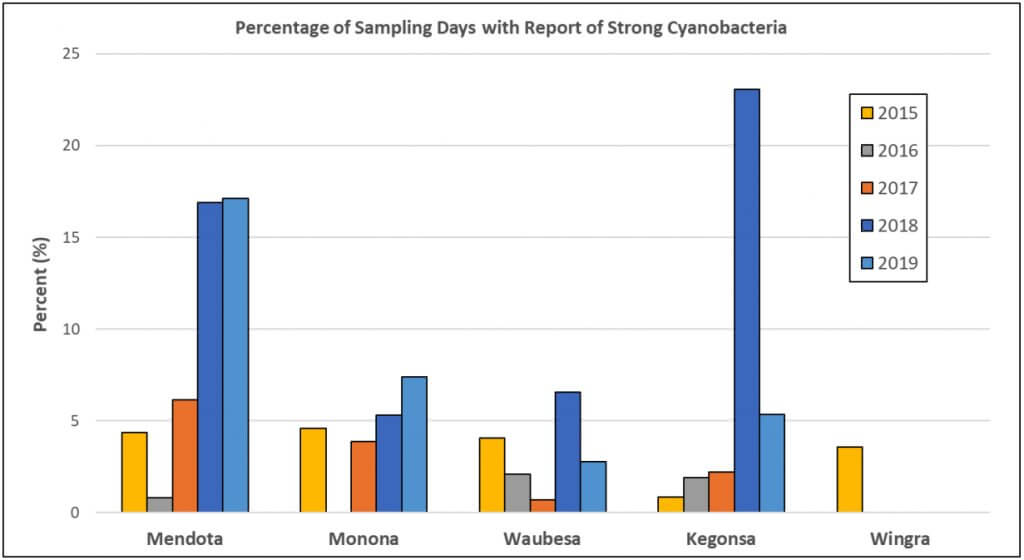
Compared to 2018, monitors reported more “strong” cyanobacteria blooms on lakes Mendota and Monona. Lake Kegonsa reports returned to a more expected total after the drastic increase witnessed in 2018. Lake Waubesa also reported fewer blooms, and Wingra continued to have no reports of “strong” cyanobacteria blooms.
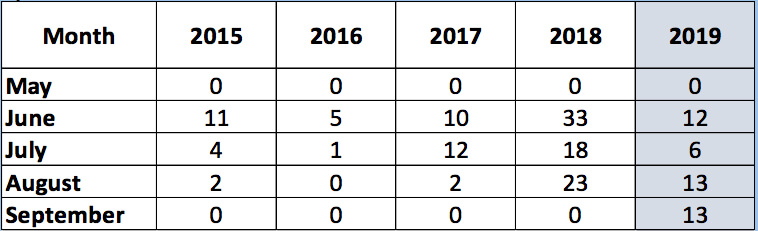
Cyanobacteria blooms occurred fairly consistently across each month of monitoring (Table 2). Unlike previous years, monitors reported significantly more blooms in September. The blooms occurred primarily on Lake Mendota where nine blooms were documented. This may be a result of increased monitoring activity later into the season. However, as predicted by limnologists, we may be seeing blooms later into the year as climate patterns shift in the Greater Madison area. In face, an early December bloom was spotted on Lake Mendota in 2019.
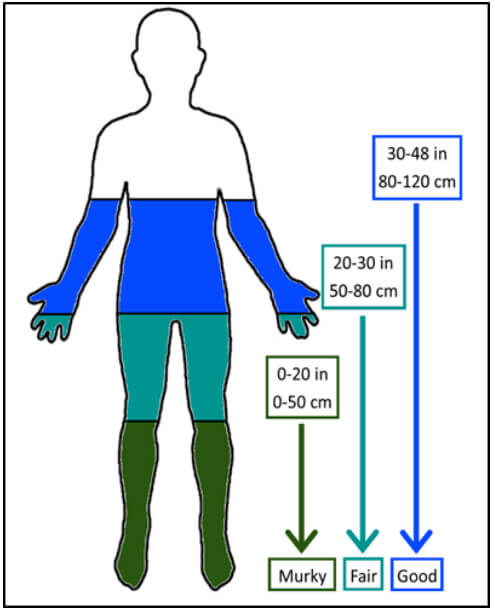
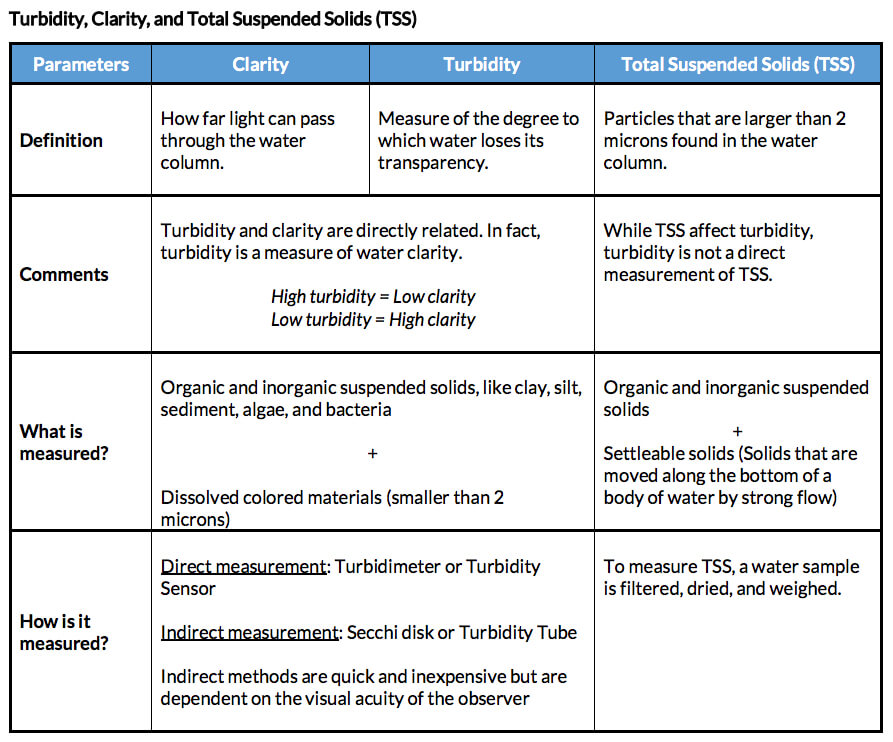
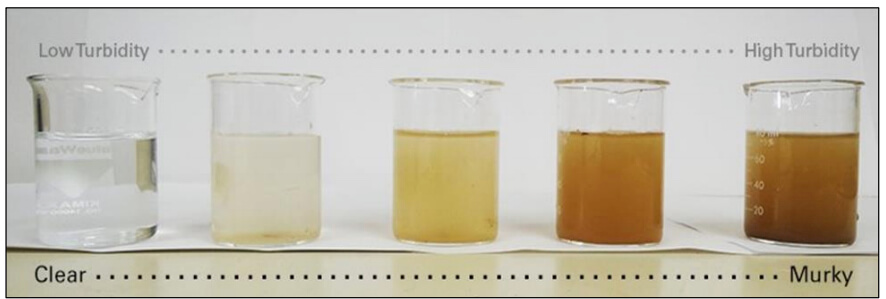
Clarity
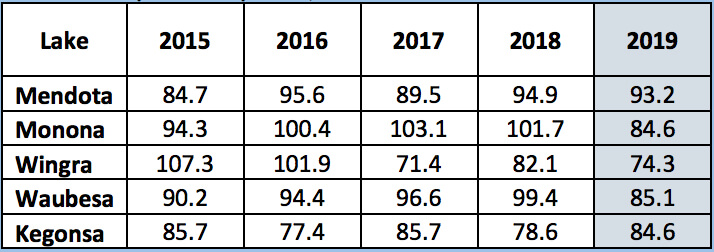
Clarity readings averaged across each lake suggest a general decline in nearshore water clarity when compared to last year (Table 3). None of the lakes achieved a 100 cm average clarity in 2019. This was a program first (since 2014 when the program began).
Increased rainfall frequency and intensity generate more overland flow throughout the watershed, resulting in a net influx of suspended solids and nutrients. Only Lake Kegonsa reported a small increase in average water clarity.
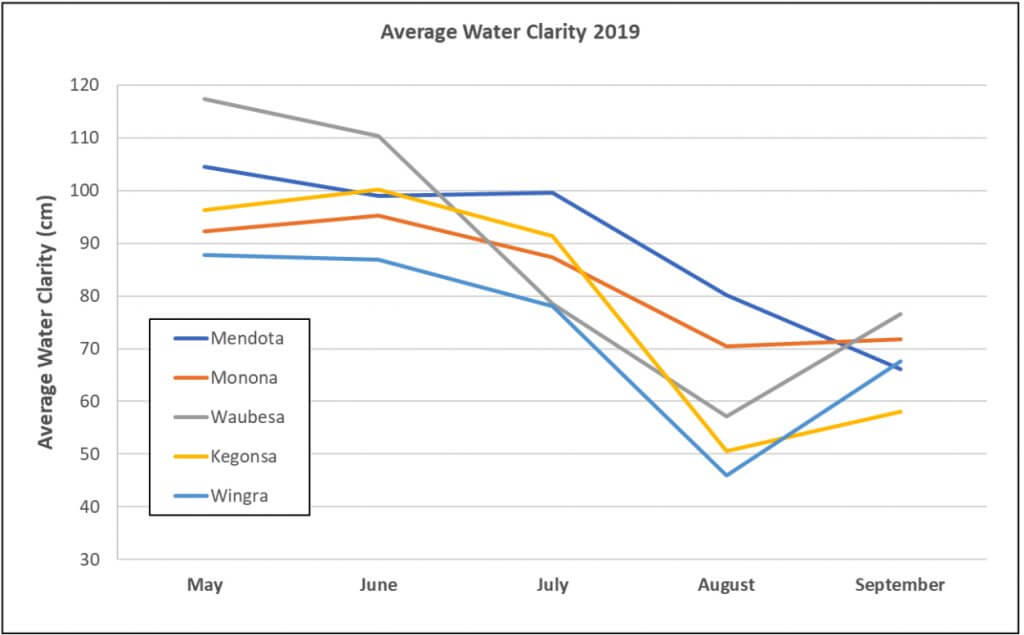
Late season clarity readings tend to improve due to reduced rainfall and decreased biotic activity (Figure 4). This phenomenon was evident in 2019. However, the improvement in clarity was mitigated by the particularly low clarity witnessed in August. The trend is clearly depicted in Figure 3, which includes lakes Monona, Waubesa, Wingra, and Kegonsa.
2019 water quality monitoring summaries, by lake
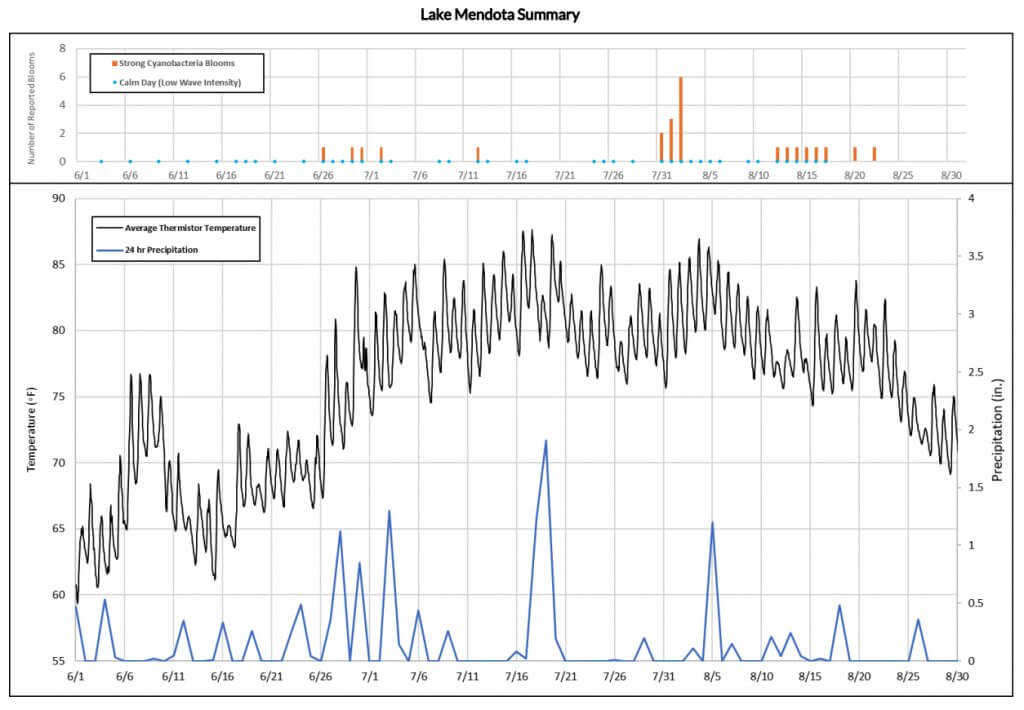
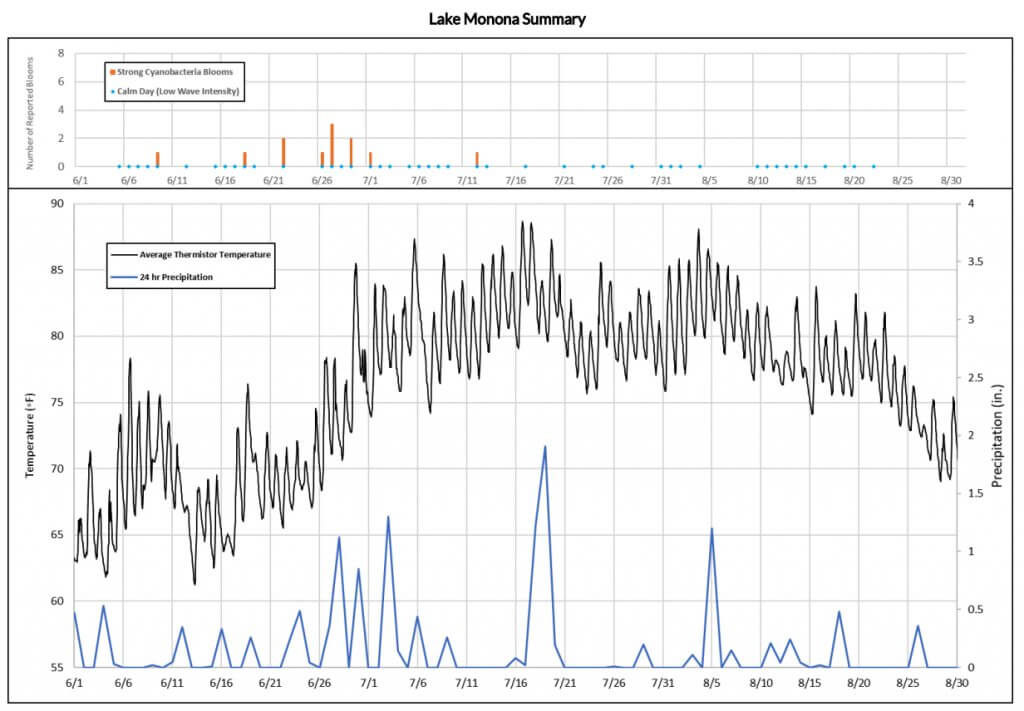
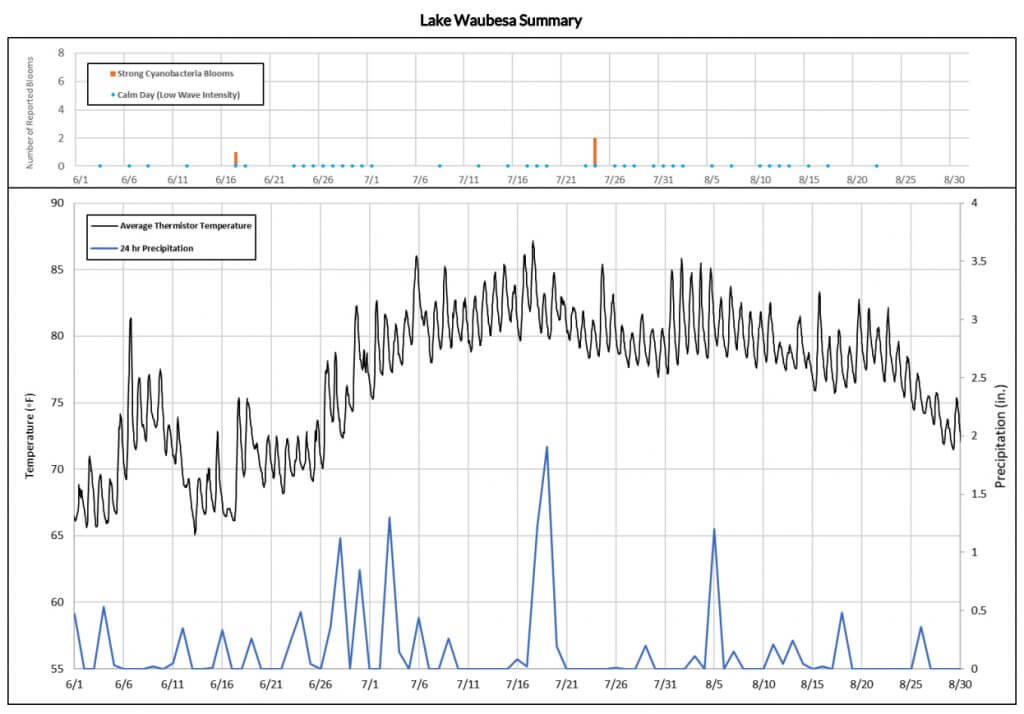
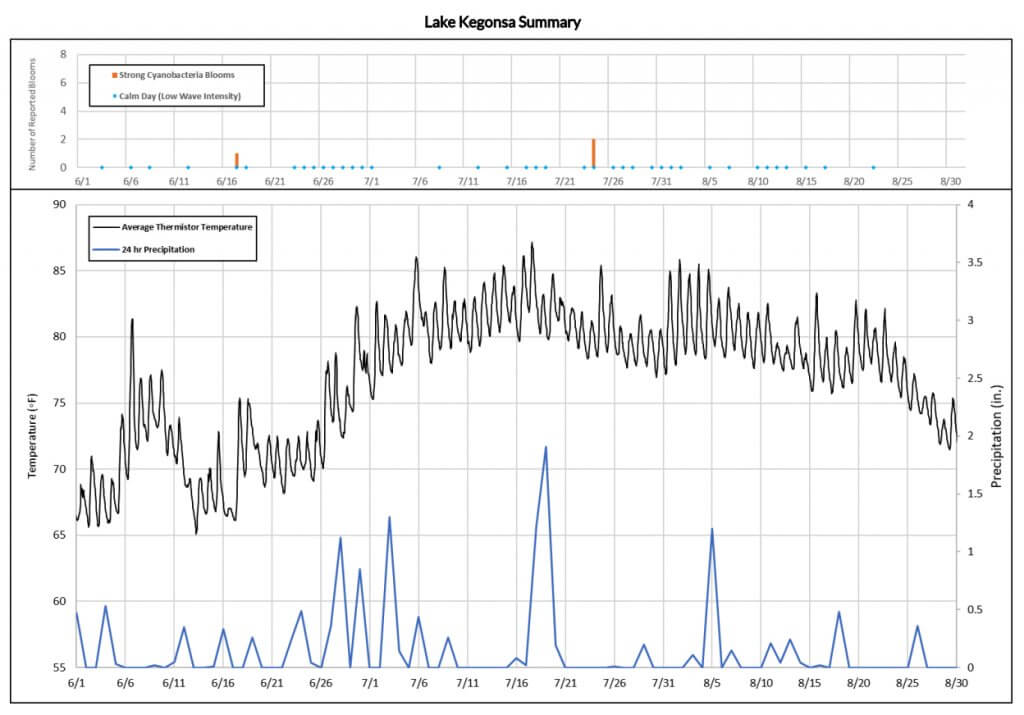
The following charts depict a summary of conditions from June 1st to August 31st on each lake. The bottom portion of the chart displays the average temperature of all hourly thermistor readings on each lake. This provides a generalized nearshore temperature profile for the monitoring season. A blue line represents 24-hr precipitation total. The Dane County Regional Airport recorded the rainfall totals, and the National Oceanic and Atmospheric Administration (NOAA) was the source of the precipitation data.
The upper portion depicts all reports of “strong” cyanobacteria blooms, while the blue dot represents a calm day. Calm days represent a typical condition advantageous for surface algae accumulation. Each graph aids in visualizing the dynamic interactions between precipitation, temperature, wind conditions, and cyanobacteria growth.
For example, on Lake Mendota around July 31st, we experienced moderate rainfall followed by increased temperatures and minimal wind. Monitors reported strong cyanobacteria blooms shortly after. There were additional examples of this phenomenon occurring on the other Yahara lakes.
It is important to note that cyanobacteria growth is not driven by the simple cause and effect of three variables. The Yahara lakes are part of a dynamic ecosystem consisting of urban and rural inputs, complicated by a changing climate and invasive species. Volunteer monitoring data will continue to be an important part of data driven decision making.
References
Download the entire 2019 Yahara Lakes Water Quality Monitoring Report